JSON Grafana plugin to fetch API data
- Grafana can support many data-sources like MySQL, PostgreSQL, Elasticsearch, CSV etc., either by default or through a strong opensource plugin ecosystem
- But there may be a requirement to integrate data-sources that are not supported by Grafana (may the datasource is in-house or proprietary)
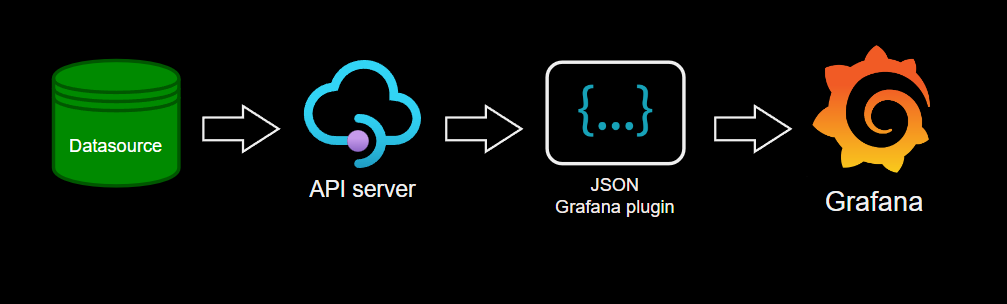
- In such cases the data-source can be integrated with Grafana by developing an API server that communicates with the “JSON” plugin in Grafana as shown below
Install JSON plugin in Grafana
Install from command line in Grafana folder
- Open a command line in the Grafana bin folder and then run the following command
grafana-cli.exe plugins install simpod-json-datasource
- This command downloads plugin from internet and keeps it in the grafana→data→plugins folder of Grafana installation
Install offline
- Download the zip file from GitHub at https://github.com/simPod/GrafanaJsonDatasource/releases
- Check Grafana version compatibility after downloading in the
plugin.jsonfile - unzip the plugin files in the grafana→data→plugins folder of Grafana installation (For example “C:\Program Files\GrafanaLabs\data\plugins")
Configure JSON plugin
- After installing JSON plugin in Grafana, create a JSON data source and fill the API server URL details as shown below
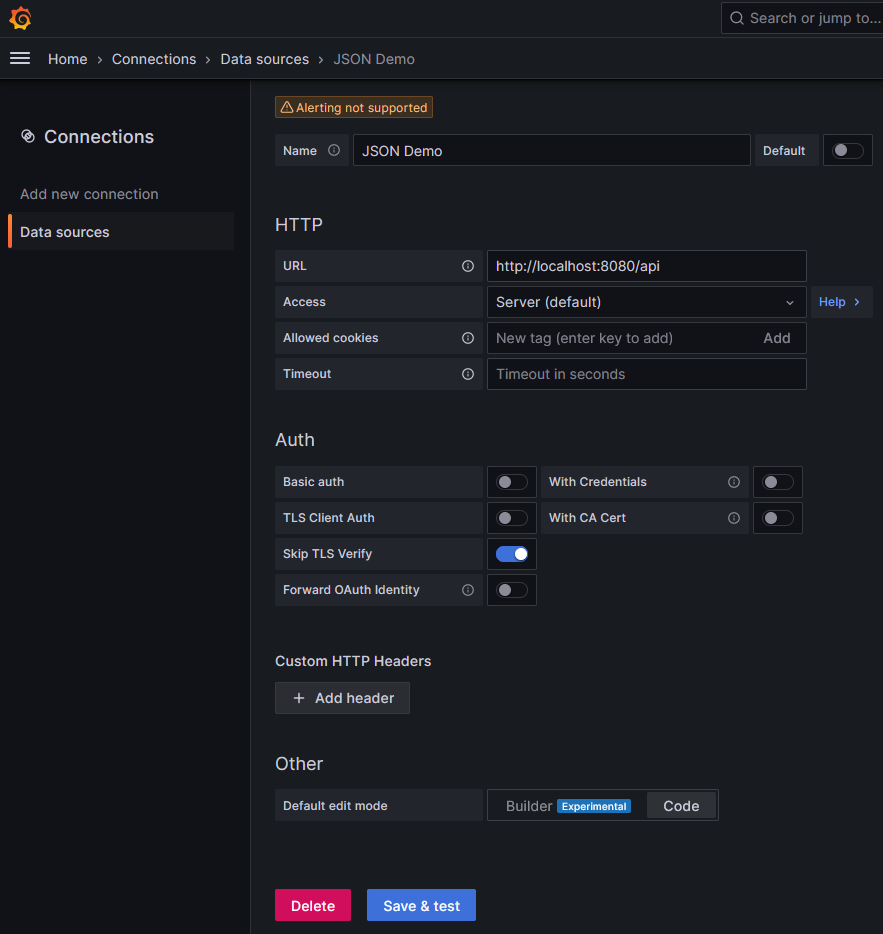
- For this example, we are hosting the API at http://localhost:8080/api
API server end points required
- The API server should implement some endpoints with specific request response formats to communicate with the JSON plugin
health check endpoint
- Request -
GET / - Response - respond with status code of 200
metrics endpoint
- Request -
POST /metrics - Request body format: The request body would be a blank object
{}or currently selected metric and payload of the Grafana panel like the following
{
  "metric": "history",
  "payload": {
    "avoid_future": "no",
    "point_id": "abc",
    "sampling_freq": "120",
    "sampling_type": "snap"
  }
}
- Response format: The response return the metrics to be populated in the metrics drop-down of the Grafana query panel like the following.
[
  {
    "label": "History",
    "value": "history"
  },
  {
    "label": "Realtime",
    "value": "real"
  }
]
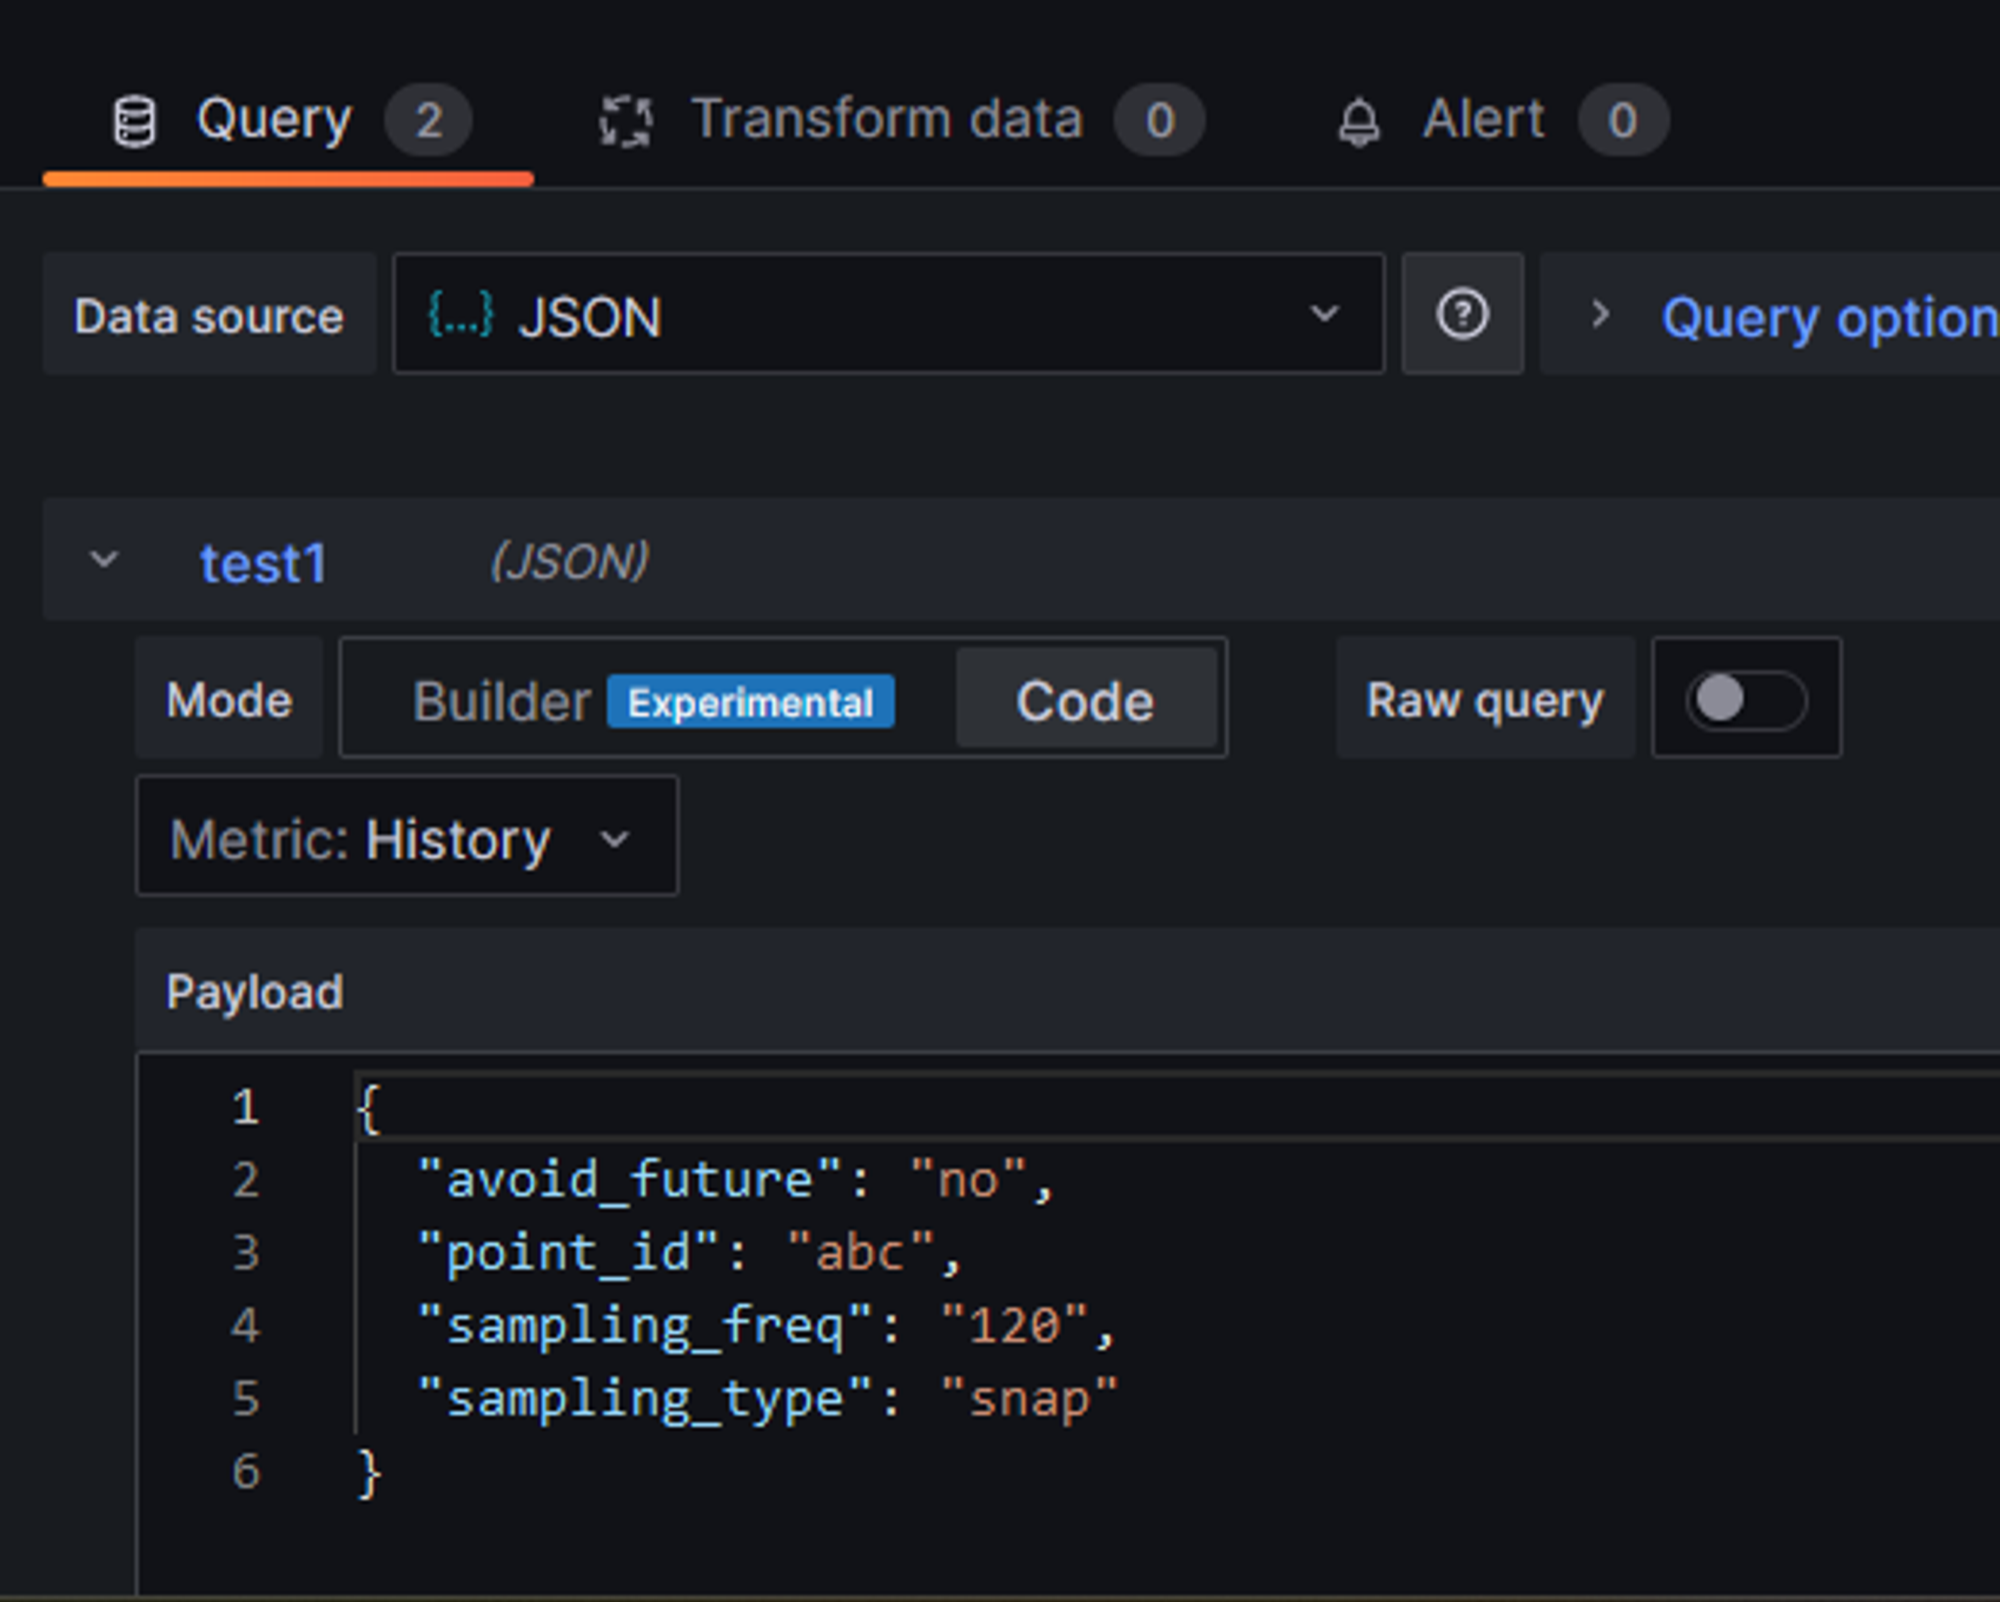
- In this scenario, the query payload can be any JSON provided by the user as shown below
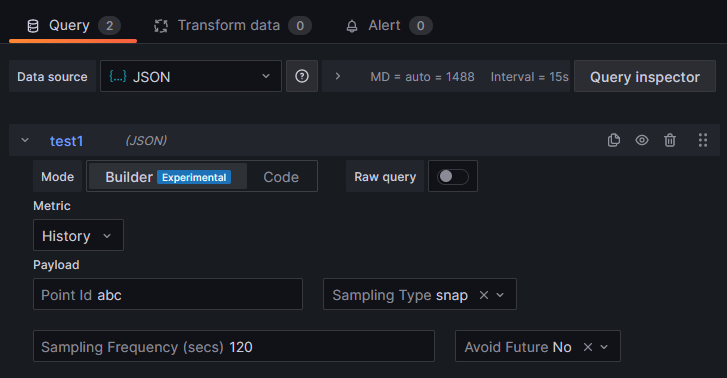
Builder mode in query editor (optional)
- By specifying the query payload schema of each metric in the metrics API response, Builder mode can be used to create the query payload in Grafana query editor.
- The following response can be returned in the metrics API endpoint which includes payload schema
[
  {
    "label": "History", "value": "history",
    "payloads": [
      {
        "label": "Point Id", "name": "point_id", "type": "input"
      },
      {
        "label": "Sampling Type", "name": "sampling_type", "type": "select",
        "placeholder": "Select Sampling Type",
        "reloadMetric": true,
        "options": [
          { "label": "Snap", "value": "snap" },
          { "label": "Average", "value": "avg" },
          { "label": "Maximum", "value": "max" },
          { "label": "Minimum", "value": "min" },
          { "label": "Raw", "value": "raw" }
        ]
      },
      {
        "label": "Avoid Future", "name": "avoid_future", "type": "select"
      }
    ]
  },
  {
    "label": "Realtime", "value": "real",
    "payloads": [
      {
        "label": "Point Id", "name": "point_id", "type": "input"
      },
      {
        "label": "Avoid Future", "name": "avoid_future", "type": "select"
      }
    ]
  }
]
- The above metrics response includes the payload schema in the “payloads” of each metric.
- The type of each metric payload attribute can be
input,select,multi-select. If the metric payload attribute type is select or multi-select, the drop-down options can be specified in theoptionsfield as shown above. - Some payload attributes can have “reloadMetric”: true” which means that the metrics endpoint will be called every time when that payload attribute is changed. This helps in dynamically changing the metric payload schema or select list options based on some inputs.
- Now the query payload can be provided in Builder mode as shown below
metric-payload-options endpoint (optional)
- In the above example, notice that no options were specified for the metric payload attribute “avoid_future”.
- In such cases where the options are not specified for “select” metric payload attributes, Grafana will call the API for fetching options to be populated in the drop-down
- Request -
POST /metric-payload-options - The request body would be like the following that contains the current metric, current payload and the name of the metric payload attribute for which options are required
{
    "metric": "history",
    "payload": {
        "point_id": "abc",
        "sampling_freq": "120",
        "sampling_type": "snap"
    },
    "name": "avoid_future"
}
- The response as shown below should contain the options for the metric payload attribute that can be populated in the select list
[
    { "label": "Yes", "value": "yes" },
    { "label": "No", "value": "no" }
]
- Payload drop down can be made dynamic with this API end point which helps in loading limited options in the select list based on other inputs of the payload.
query endpoint
- Request -
POST /query - The request body would contain the query like the following
{
  "app": "panel-editor",
  "requestId": "Q121",
  "timezone": "browser",
  "panelId": 1,
  "dashboardUID": "ba26ffbf-5ad2-4704-85a8-1ce861676c2e",
  "range": {
    "from": "2024-05-25T21:53:23.557Z",
    "to": "2024-05-26T03:53:23.557Z",
    "raw": {
      "from": "now-6h",
      "to": "now"
    }
  },
  "timeInfo": "",
  "interval": "15s",
  "intervalMs": 15000,
  "targets": [
    {
      "datasource": {
        "type": "simpod-json-datasource",
        "uid": "f41876b9-c48a-4f2c-8ea8-1ea910bfb453"
      },
      "editorMode": "builder",
      "payload": {
        "point_id": "abc",
        "sampling_freq": "120",
        "sampling_type": "snap",
        "avoid_future": "no"
      },
      "refId": "test1",
      "target": "history"
    },
    {
      "datasource": {
        "type": "simpod-json-datasource",
        "uid": "f41876b9-c48a-4f2c-8ea8-1ea910bfb453"
      },
      "editorMode": "builder",
      "hide": false,
      "payload": {
        "avoid_future": "no",
        "point_id": "abc",
        "sampling_freq": "60",
        "sampling_type": "raw"
      },
      "refId": "test2",
      "target": "history"
    }
  ],
  "maxDataPoints": 1488,
  "scopedVars": {
    "__interval": {
      "text": "15s",
      "value": "15s"
    },
    "__interval_ms": {
      "text": "15000",
      "value": 15000
    }
  },
  "startTime": 1716695603558,
  "rangeRaw": {
    "from": "now-6h",
    "to": "now"
  },
  "filters": [],
  "adhocFilters": []
}
- The from time, to time can be extracted from
queryData["range"]["from"]andqueryData["range"]["to"]of the query - The
targetslist contains the query from each query of the panel - Each item in
targetslist will have the metric name and payload JSON that can be used by the API server to fetch data from required sources - The response as shown below would contain the data that can be displayed in Grafana panel as shown below
[
    {
        "target": "test1",
        "datapoints": [
            [273, 1716695805559],
            [212, 1716695925559],
            [121, 1716696045559]
        ]
    },
    {
        "target": "test2",
        "datapoints": [
            [131, 1716695805559],
            [289, 1716695865559],
            [240, 1716695925559],
            [121, 1716695985559],
            [135, 1716696045559],
            [102, 1716696105559]]
    }
]
- Each object in the response list will be used to create a series in the panel.
- Each data point should be in the format of [value, timestamp]. The value can be a float and the timestamp should be an integer which is the duration from UNIX epoch in milliseconds.
Create an API server in python
- The API server can be implemented in any language to server the HTTP requests from Grafana.
- The following is the python flask based implementation of the API server mentioned in this post.
from flask import Flask, request
from copy import deepcopy
import datetime as dt
import pandas as pd
import random

pointIdPayload = {
    "label": "Point Id",
    "name": "point_id",
    "type": "input"
}
samplingTypePayload = {
    "label": "Sampling Type",
    "name": "sampling_type",
    "type": "select",
    "placeholder": "Select Sampling Type",
    "reloadMetric": True,
    "options": [
        {"label": "Snap", "value": "snap"},
        {"label": "Average", "value": "avg"},
        {"label": "Maximum", "value": "max"},
        {"label": "Minimum", "value": "min"},
        {"label": "Raw", "value": "raw"}
    ]
}
samplingFreqPayload = {
    "label": "Sampling Frequency (secs)",
    "name": "sampling_freq",
    "type": "input"
}
avoidFuturePayload = {
    "label": "Avoid Future",
    "name": "avoid_future",
    "type": "select",
    # "options": [
    #     {"label": "Yes", "value": "yes"},
    #     {"label": "No", "value": "no"}
    # ]
}

historyMetric = {
    "label": "History",
    "value": "history",
    "payloads": [pointIdPayload, samplingTypePayload, samplingFreqPayload, avoidFuturePayload]
}
realTimeMetric = {
    "label": "Realtime",
    "value": "real",
    "payloads": [pointIdPayload, avoidFuturePayload]
}

metrics = [historyMetric, realTimeMetric]

app = Flask(__name__)

@app.route("/api")
def healthCheck():
    return ""

@app.route("/api/metrics", methods=["POST"])
def getMetrics():
    metricsFinal = deepcopy(metrics)
    queryData = request.get_json()
    metricName = queryData.get("metric", "")
    samplingType = queryData.get("payload", {}).get("sampling_type", "")
    if metricName == "history" and samplingType == "raw":
        metricsFinal[0]["payloads"] = [pointIdPayload,
                                       samplingTypePayload, avoidFuturePayload]
    return metricsFinal

@app.route("/api/metric-payload-options", methods=["POST"])
def getMetricPayloadOptions():
    queryData = request.get_json()
    # metricName = queryData.get("metric", "")
    # currentPayload = queryData.get("payload", {})
    payloadOptions = []
    reqPayloadName = queryData.get("name", "")
    if reqPayloadName == "avoid_future":
        payloadOptions = [{"label": "Yes", "value": "yes"},
                          {"label": "No", "value": "no"}]
    return payloadOptions

@app.route("/api/query", methods=["POST"])
def queryData():
    queryData = request.get_json()
    print(queryData)
    startTime = dt.datetime.strptime(
        queryData["range"]["from"], "%Y-%m-%dT%H:%M:%S.%fZ")
    endTime = dt.datetime.strptime(
        queryData["range"]["to"], "%Y-%m-%dT%H:%M:%S.%fZ")
    targets = queryData["targets"]
    response = []
    for t in targets:
        targetPayload = t.get("payload", {})
        targetData = {
            "target": t["refId"],
            "datapoints": []
        }
        samplFreq = int(targetPayload.get("sampling_freq", "60"))
        for sampleTime in pd.date_range(startTime, endTime, freq=dt.timedelta(seconds=samplFreq)):
            targetData["datapoints"].append(
                [random.randint(100, 300), int(sampleTime.timestamp()*1000)])
        response.append(targetData)
    # print(response)
    return response

app.run(host="0.0.0.0", port=8080, debug=True)
Video
Video on this post can be seen here
References
- JSON plugin documentation - https://grafana.com/grafana/plugins/simpod-json-datasource/
- JSON plugin GitHub repository - https://github.com/simPod/grafana-json-datasource
Comments
Post a Comment