Visualize csv in Grafana with Infinity datasource
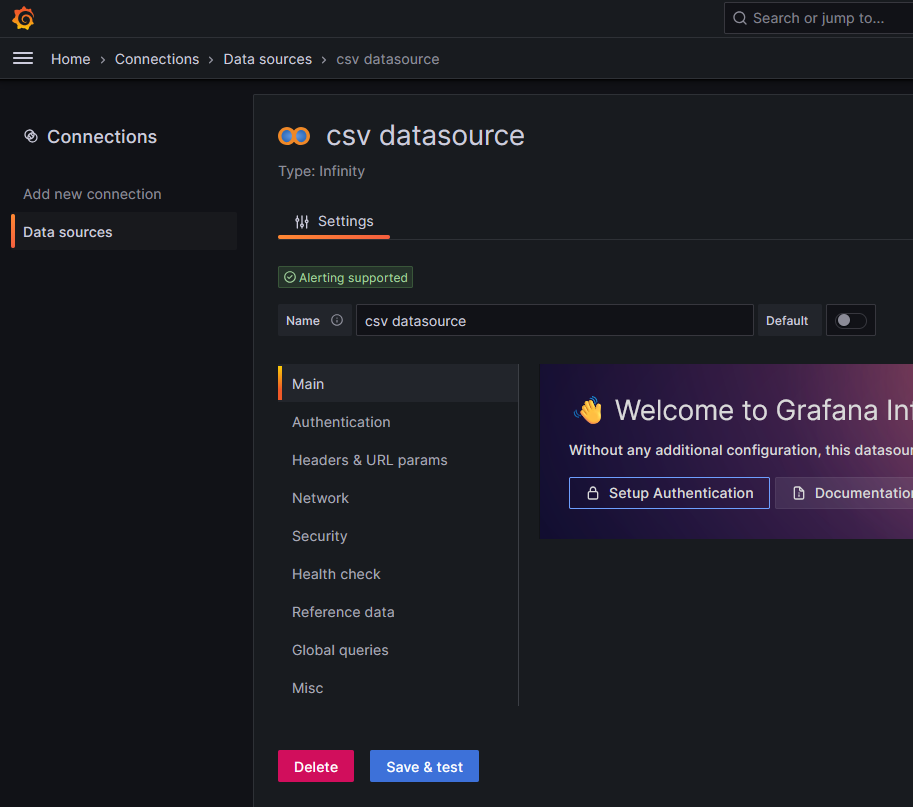
Install Grafana Infinity Datasource
Grafana Infinity datasource plugin can be used to visualize data from csv
Install the plugin from command line
- Run the following command in Grafana bin folder
grafana-cli.exe plugins install yesoreyeram-infinity-datasource
Install offline
- Download the relevant zip file from https://github.com/grafana/grafana-infinity-datasource/releases/
- Check Grafana version compatibility after downloading in the
plugin.jsonfile - unzip the plugin files in the grafana→data→plugins folder of Grafana installation (For example “C:\Program Files\GrafanaLabs\data\plugins")
Load csv from URL
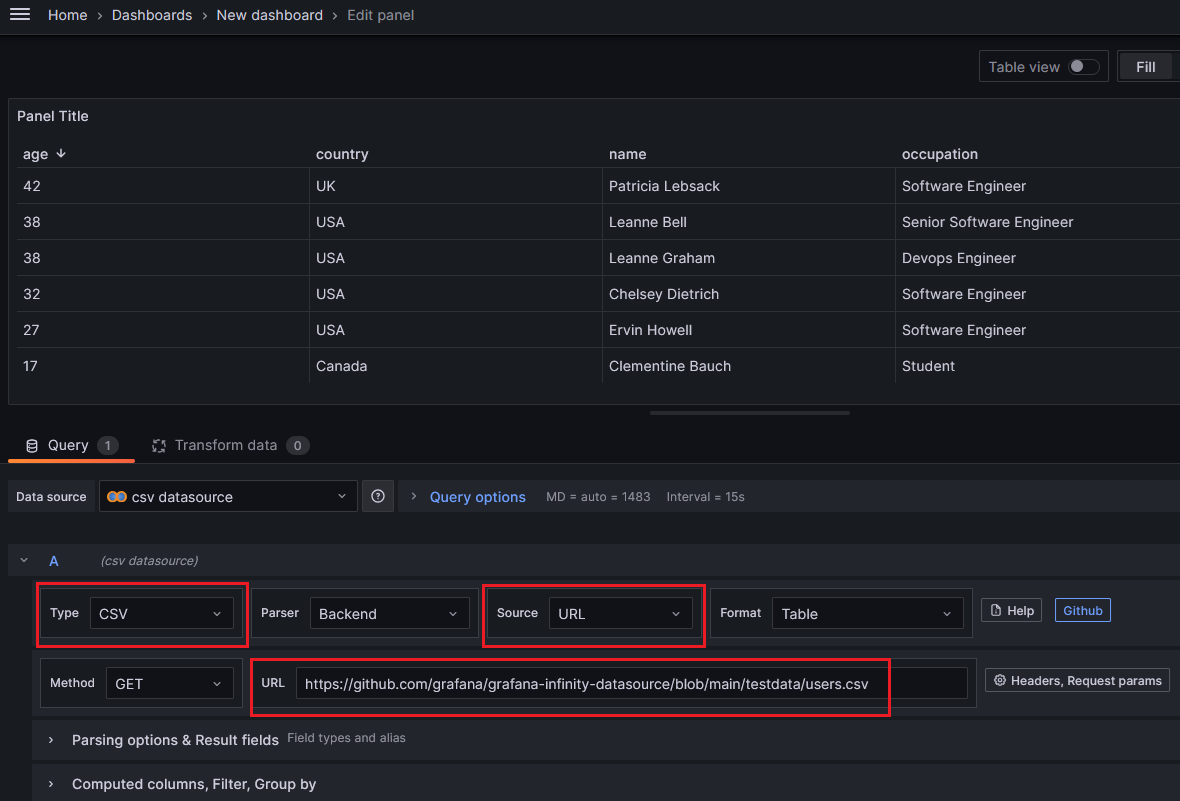
- While editing the panel, select the infinity datasource, select the type as csv, source as URL and write the csv file URL in the URL field.
Load csv from file or inline text
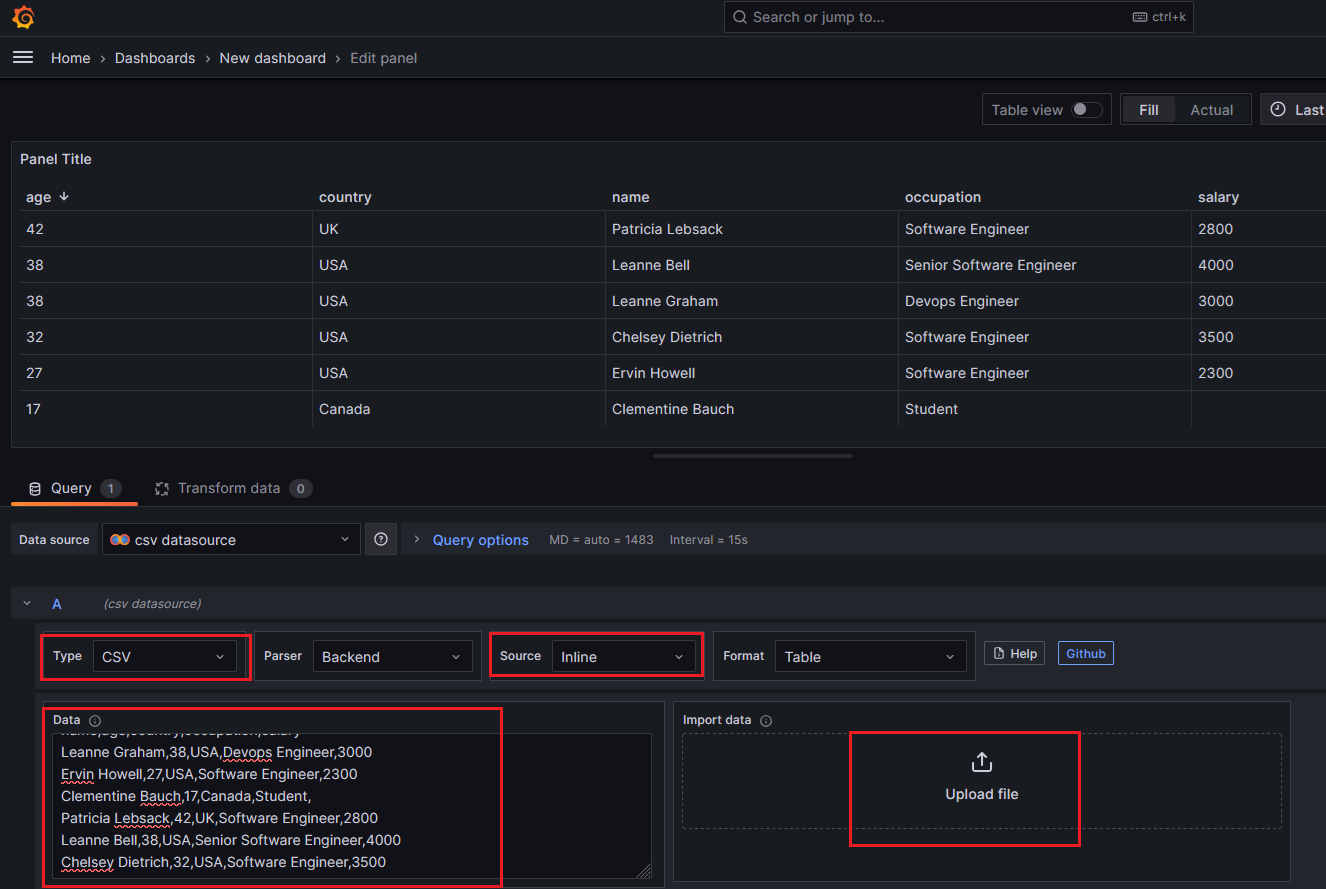
- While editing the panel, select the infinity datasource, select the type as csv, source as Inline.
- Either the csv text can be pasted in the text box or the csv file can be uploaded.
- If the csv data uses tabs instead of commas, expand the “Parsing options & Result fields” and specify the delimiter as tab
Specify csv column data types for visualization

- After importing csv data, relevant columns and their data types can be declared for visualizing the data
- While editing the panel, expand the “Parsing options & Result fields” and add the required columns and their data types as shown below
Visualize csv timeseries
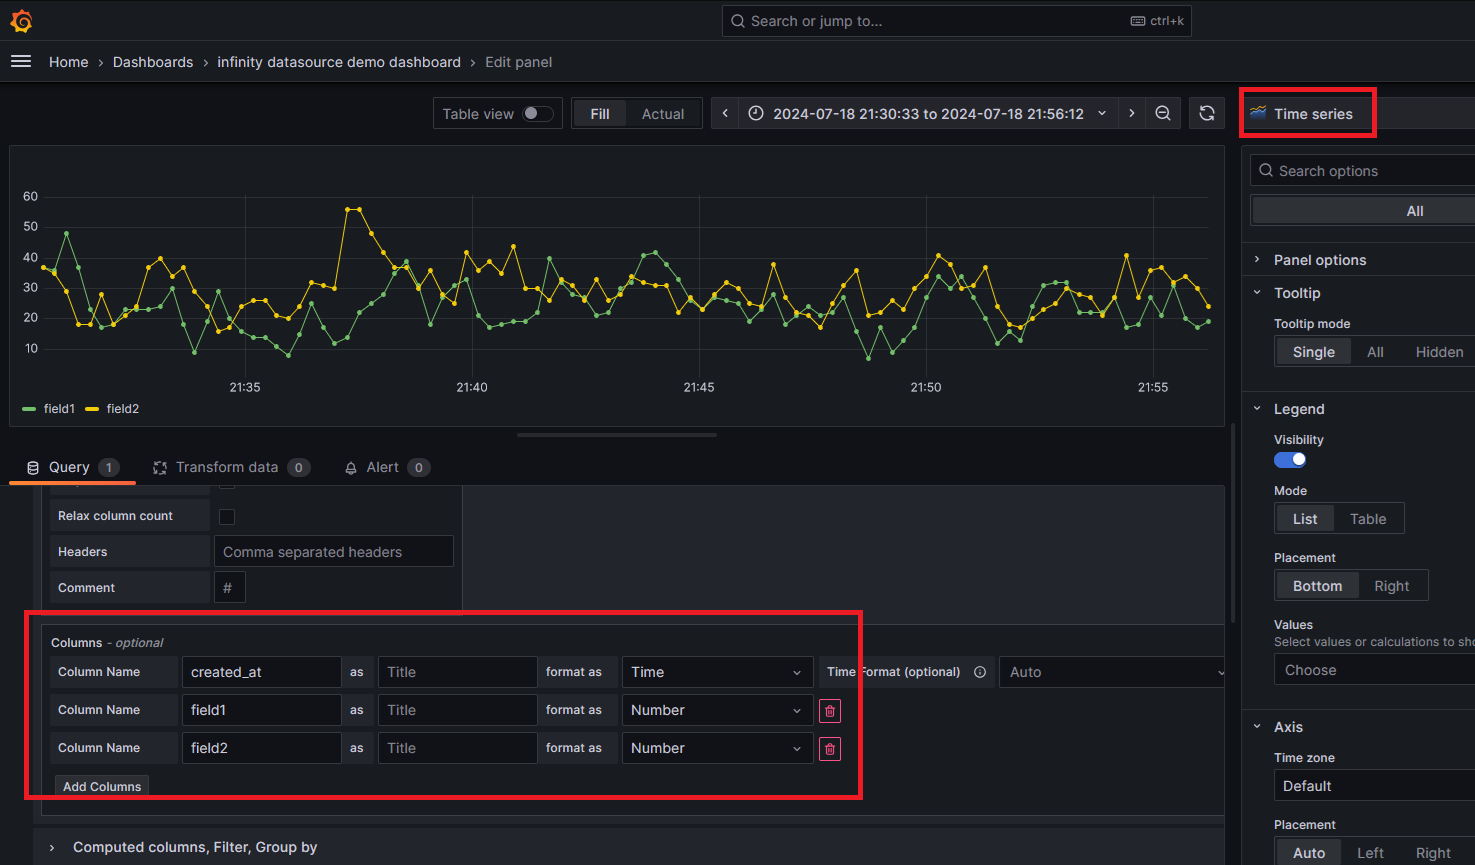
- In the “Parsing options & Result fields” of the panel editing screen, add the required csv columns for time-series visualization as shown above.
- Select the visualization type as Time series in the top right of the editing panel.
Visualize geographic data from csv
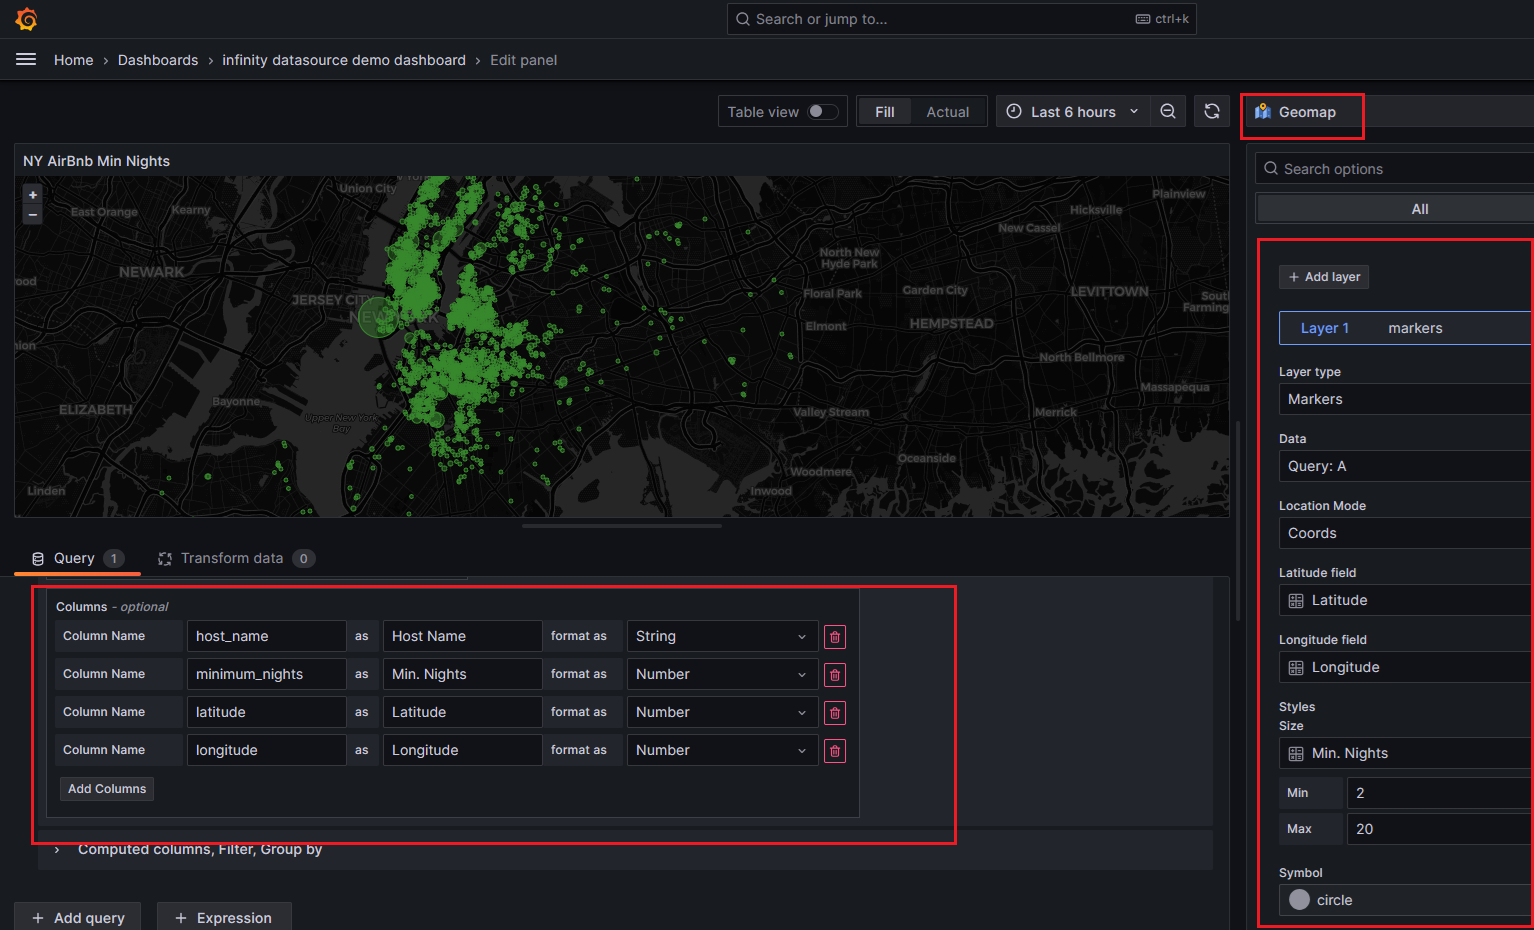
- In the panel editing window, change the visualization type to Geomap
- Add the required csv columns for visualization in the “Parsing options & Result fields” section. Notice the columns for latitude and longitude are also added
- In the right pane, add a data layer and select the location mode, latitude, longitude columns, marker size column.
- Instead of the layer type “Markers” other layer types like heat-map can also be used.
- Also many other settings like base map layer, initial view zoom etc can also be configured.
Visualize non-timeseries data in csv
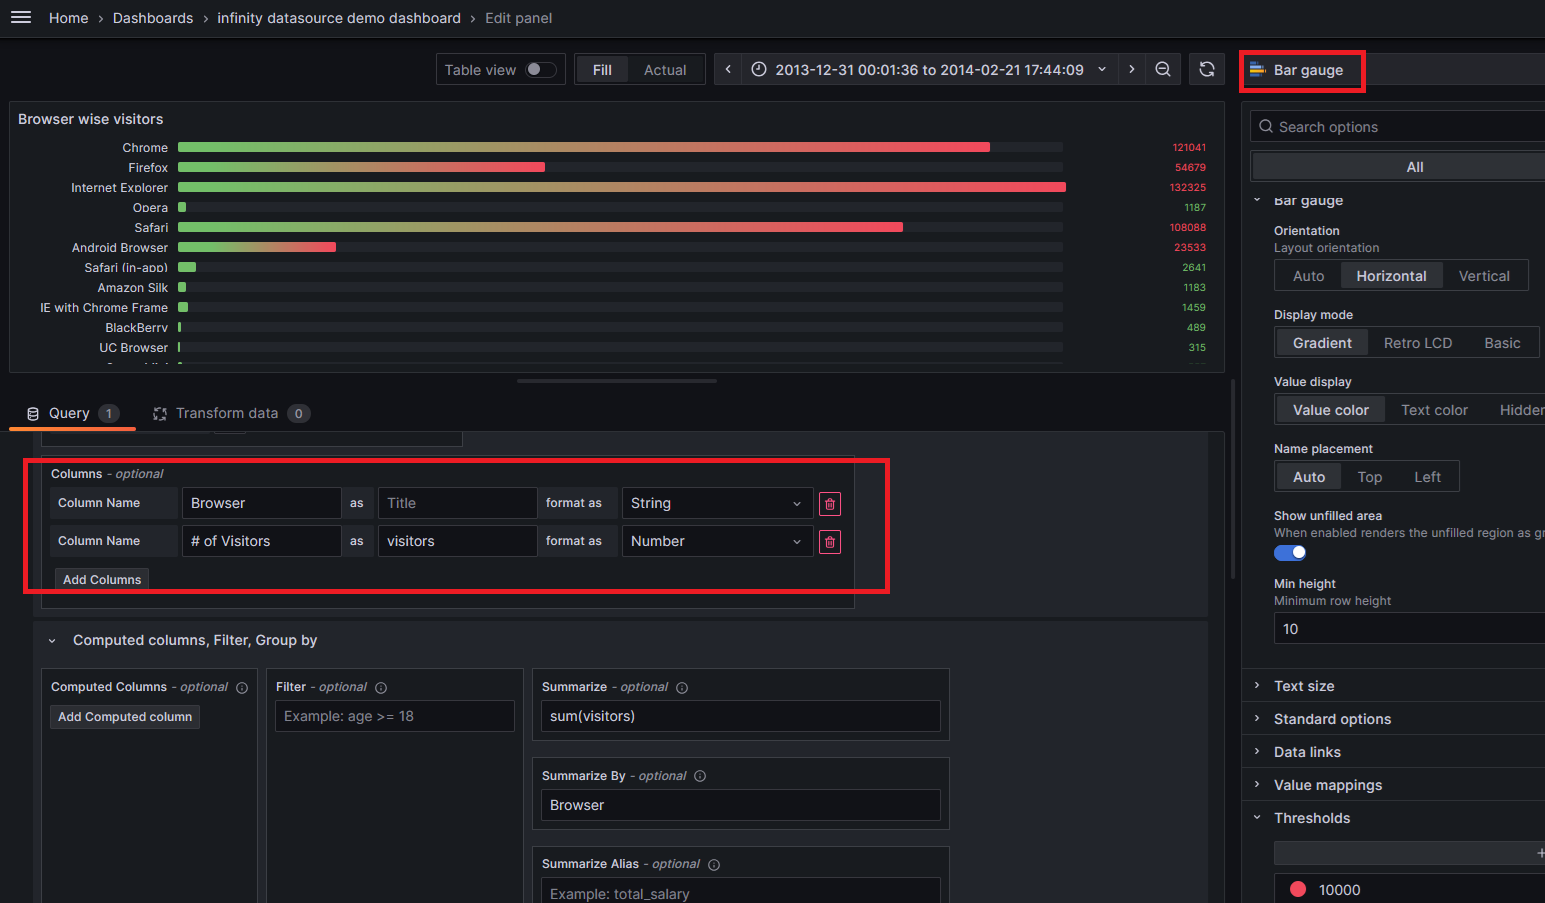
- In the panel editing window, change the visualization type to something like a bar chart
- Add the required csv columns for visualization in the “Parsing options & Result fields” section.
- Use the csv columns for visualization
Group rows, filter rows, create derived columns
This feature can be used when the parser is backend
Calculated columns
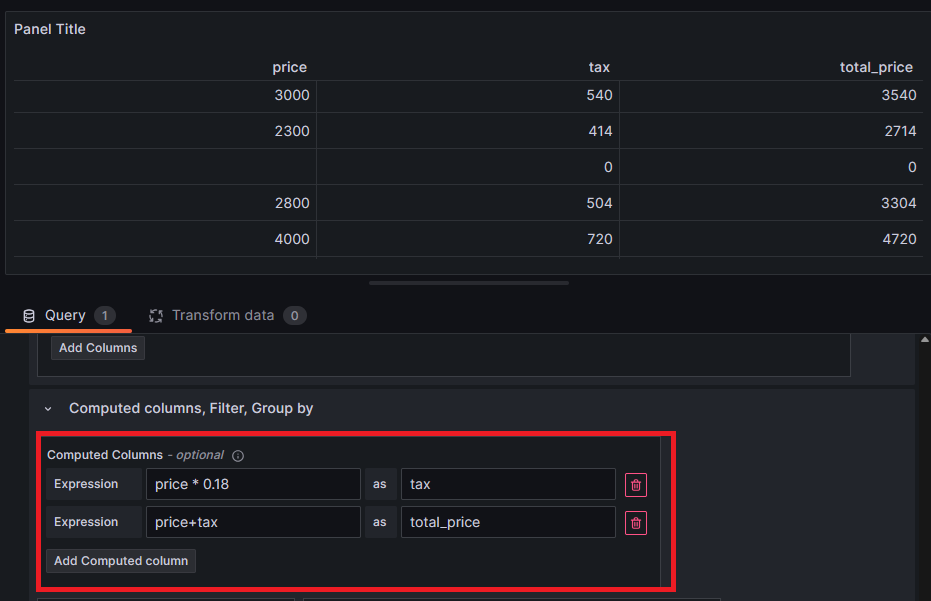
- New columns can be derived using the operators
* / + -
Filter rows

- csv rows can be filtered by specifying the condition in the filter input
Group rows by column
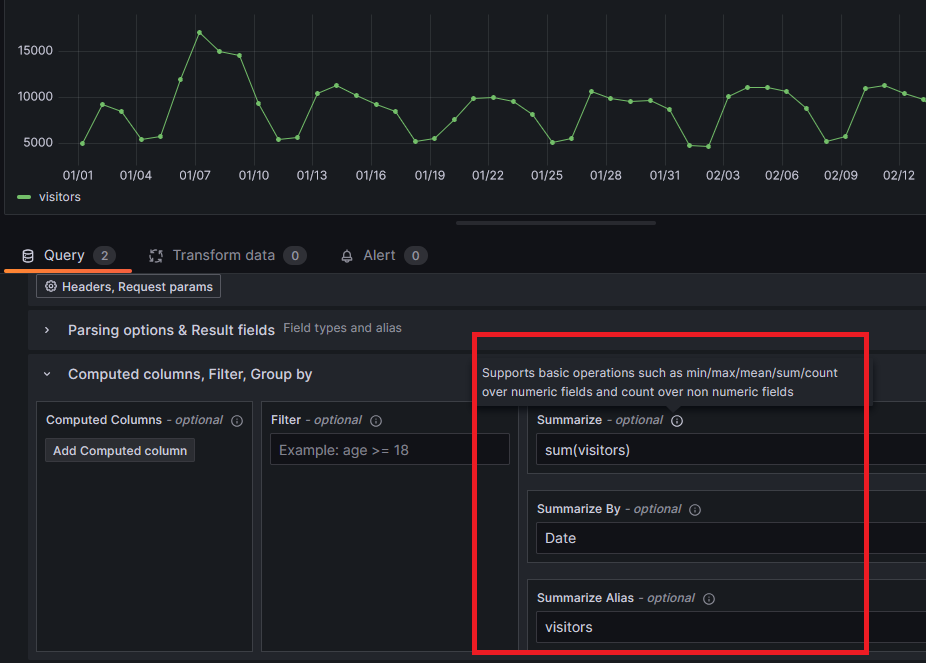
- Rows can be grouped based on the column value using the summarize section as shown above
- In the above example, the visitors for the same date are added and a new table is created for visualization with the grouped data
Video
Video on this post can be seen here
References
- Infinity datasource plugin docs - https://grafana.com/docs/plugins/yesoreyeram-infinity-datasource/latest/csv/
- Sample csv 1 - https://www.kaggle.com/datasets/cityofLA/lacity.org-website-traffic?resource=download
- Sample csv 2 - https://www.kaggle.com/datasets/dgomonov/new-york-city-airbnb-open-data
- Sample csv 3 - https://github.com/grafana/grafana-infinity-datasource/raw/main/testdata/misc/thingspeak_38629.csv
Comments
Post a Comment