Raspberry pi based temperature monitoring and alerting system
- In this post we will create a Temperature monitoring and alerting system.
- Grafana can be configured to monitor the temperature continuously and generate alerts if the temperature crosses a defined threshold.
- The historical temperature can be visualized in Grafana dashboards.
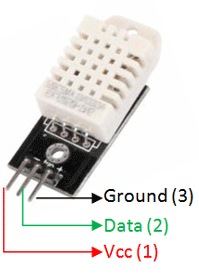
Temperature sensor
- DHT22 can be used as a temperature and humidity sensor. Two pins should be connected to 3.3 Volts and ground. The data pin can provides the temperature and humidity information
Read temperature and humidity data from DHT22 with Raspberry pi
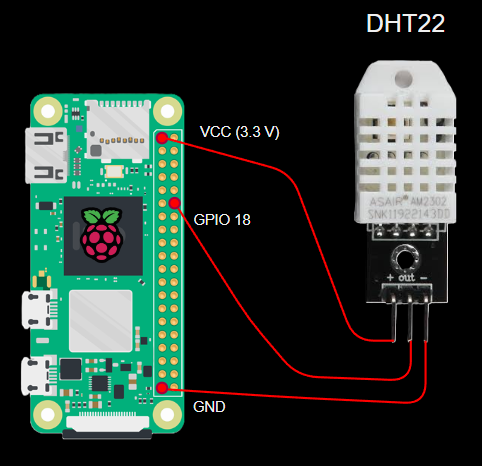

- DHT22 sensor data can be read by python script running on a Raspberry pi.
- The VCC pin and ground pin of the sensor can be connecting to VCC and ground pins of Raspberry pin as shown above
- The data pin of Raspberry pi can be connected to one of the GPIO pins of Raspberry pi. For this example, the data pin of DHT22 is connected to GPIO 18 of Raspberry pi.
Python code to read DHT22 data in Raspberry pi
- Install Adafruit_DHT python library on Raspberry pi command line with the command
python3 -m pip install Adafruit_DHT - Also install a psycopg2 dependency using the command
sudo apt install python3-psycopg2 - The “read_retry” function of the python module can be used to read the temperature and humidity data from the sensor as shown below
# temp_sensor.py
import Adafruit_DHT
import time

sensor = Adafruit_DHT.DHT22

# using GPIO18
pin = 18

while True:
    # Try to grab a sensor reading.  Use the read_retry method which will retry up
    # to 15 times to get a sensor reading (waiting 2 seconds between each retry).
    humidity, temperature = Adafruit_DHT.read_retry(sensor, pin)

    if humidity is not None and temperature is not None:
        print('Temp={0:0.1f}*C  Humidity={1:0.1f}%'.format(temperature, humidity))
        time.sleep(1)
    else:
        print('Failed to get reading. Try again!')
- The above python script reads the temperature and humidity from DHT22 sensor every second and prints it on the command line as shown below

Data pipeline for storing sensor data in real time
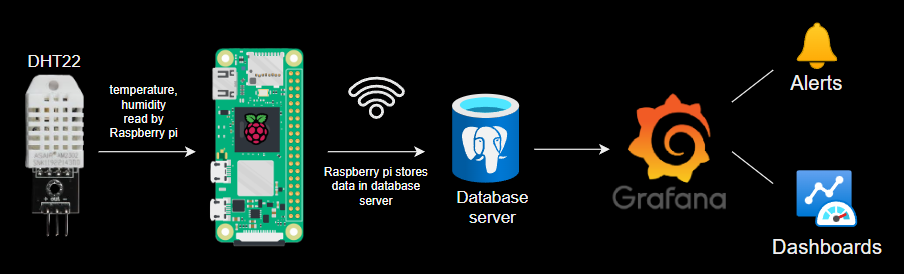
- At regular intervals (say 5 mins), raspberry pi will read temperature and humidity data from DHT22 sensor and store it in a database server. This data can be used for visualization and alerting
- The database server will be in the same WiFi network of the Raspberry Pi
- PostgreSQL is used as a database for data storage in this example
- The database can be integrated with Grafana as datasource to create dashboards and alerts
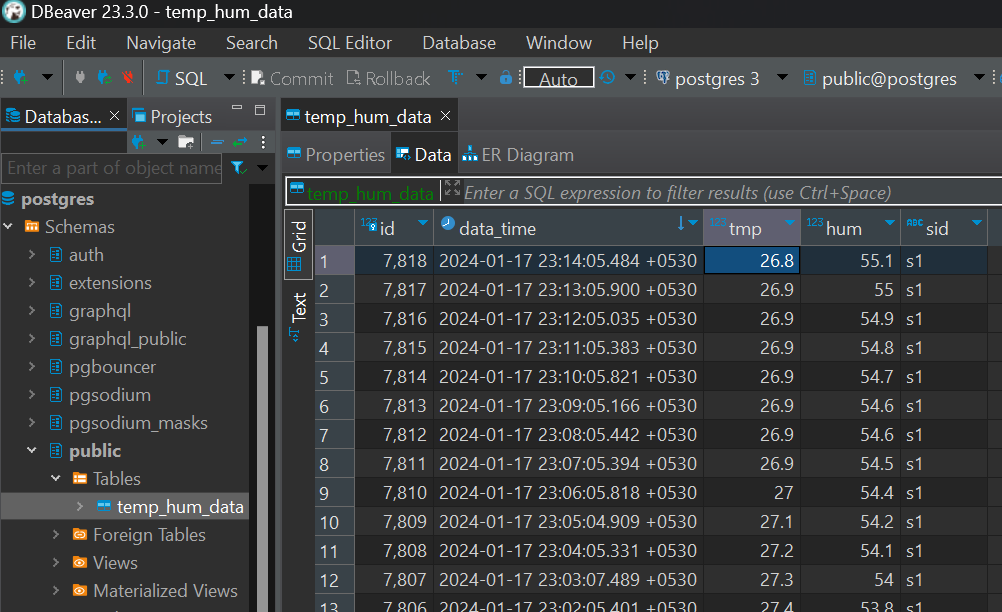
Database for sensor data storage
- PostgreSQL database is used for this example. Any database can be used for this purpose provided the integration with Grafana is easy
- The database will contain the columns for data timestamp, sensor tag, temperature, humidity and an auto generated row id
- The table can be created in a PostgreSQL database using the below SQL
create table
  public.temp_hum_data (
    id bigint generated by default as identity,
    data_time timestamp with time zone not null default now(),
    tmp real not null,
    hum real not null,
    sid text not null,
    constraint temp_hum_data_pkey primary key (id),
    constraint temp_hum_data_sid_unique unique (data_time, sid),
    constraint temp_hum_data_sid_check check ((length(sid) < 50))
  ) tablespace pg_default;
- A simple data insert SQL query would be as follows
INSERT INTO public.temp_hum_data (tmp, hum, sid)
VALUES
  (30, 55, 's1') on conflict (sid, data_time) do
update
set
  hum = excluded.hum,
  tmp = excluded.tmp;
Python code to push sensor data to database
- A simple data insert python utility class can be created as shown below. The “insertData” function can be used to push data to the database after initializing the python class with database configuration.
# tmpHumDb.py
import psycopg2

class TmpHumDb:
    def __init__(self, hostStr, dbPort, dbStr, uNameStr, dbPassStr) -> None:
        self.hostStr = hostStr
        self.dbPort = dbPort
        self.dbStr = dbStr
        self.uNameStr = uNameStr
        self.dbPassStr = dbPassStr

    def insertData(self, tmp, hum, sensorId):
        try:
            conn = psycopg2.connect(host=self.hostStr, port=self.dbPort,
                                    dbname=self.dbStr, user=self.uNameStr, password=self.dbPassStr)

            # get a cursor object from the connection
            cur = conn.cursor()

            # prepare data insertion rows
            dataInsertionTuples = [(tmp, hum, sensorId)]

            # create sql command for rows insertion
            dataText = ','.join(cur.mogrify('(%s,%s,%s)', row).decode(
                "utf-8") for row in dataInsertionTuples)

            sqlTxt = 'INSERT INTO public.temp_hum_data\
                    (tmp, hum, sid)\
                    VALUES {0} on conflict (sid, data_time) \
                do update set hum = excluded.hum, tmp=excluded.tmp'.format(dataText)

            # execute the sql to perform insertion
            cur.execute(sqlTxt)

            rowCount = cur.rowcount
            print("number of inserted rows =", rowCount)

            # commit the changes
            conn.commit()
        except (Exception, psycopg2.Error) as error:
            print("Error while interacting with PostgreSQL...\n", error)
        finally:
            if (conn):
                # close the cursor object to avoid memory leaks
                cur.close()
                # close the connection object also
                conn.close()
- The above code also overrides the duplicate rows if any, while inserting the data
- psycopg2 python module is used for interacting with PostgreSQL database. It can be installed in the Raspberry Pi using the command
python3 -m pip install psycopg2
Data insertion testing
- A simple python code that pushes a dummy data row can be executed to check if data can be successfully pushed into the database without any errors.
# test_db.py
# test the data insertion into database with dummy data
from tmpHumDb import TmpHumDb

tmpHumDb = TmpHumDb(hostStr="db.hrbklzzfynteyhryowbt.supabase.co", dbPort=5432,
                    dbStr="postgres", uNameStr="postgres", dbPassStr="s1EIf2Gl4g4bWsrX")
tmpHumDb.insertData(30, 55, "s1")
print("data insertion testing complete...")
Python code to fetch sensor data
- A simple python class can be created to temperature and humidity data from the DHT22 sensor connected to Raspberry pi. The “getTempHum” function can be called to fetch sensor data after initializing the class with the GPIO pin number of the connected DHT22 sensor
# tmpHumSensor.py
import Adafruit_DHT

class TmpHumSensor:
    def __init__(self, pin) -> None:
        self.pin = pin
        self.sensor = Adafruit_DHT.DHT22

    def getTempHum(self):
        humidity, temperature = Adafruit_DHT.read_retry(self.sensor, self.pin)
        if humidity is not None and temperature is not None:
            return {"tmp": temperature, "hum": humidity}
        else:
            return None
Main python script
- Using the data insertion and data fetch classes shown above, a simple python script can be used to push sensor data into database as shown below
- The script will send one sample of sensor data. The script can be run at regular intervals (like every 5 mins) to continuously push sensor data to the database
# index.py
from tmpHumDb import TmpHumDb
from tmpHumSensor import TmpHumSensor

sensorId = "s1"
tmpHumDb = TmpHumDb(hostStr="localhost", dbPort=5432,
                    dbStr="postgres", uNameStr="postgres", dbPassStr="pass")
sensor = TmpHumSensor(pin=18)

tmpHumDict = sensor.getTempHum()
if tmpHumDict == None:
    print("Error retrieving temp hum from sensor")
    exit(0)

tmpHumDb.insertData(tmpHumDict["tmp"], tmpHumDict["hum"], sensorId)
Schedule the sensor data storage script
- Run the
crontab -eand add the line below at the last line of the file. It create a cron job that runs the temperature and humidity storage script every 5 minutes */5 * * * * python3 /path/to/index.py- Hence the sensor data will be recorded in the database every 5 mins
Visualize the sensor data in a Grafana dashboard
Grafana datasource for database
- PostgreSQL Grafana datasource can be created in Grafana to integrate the database with Grafana for visualization and alerting as shown below
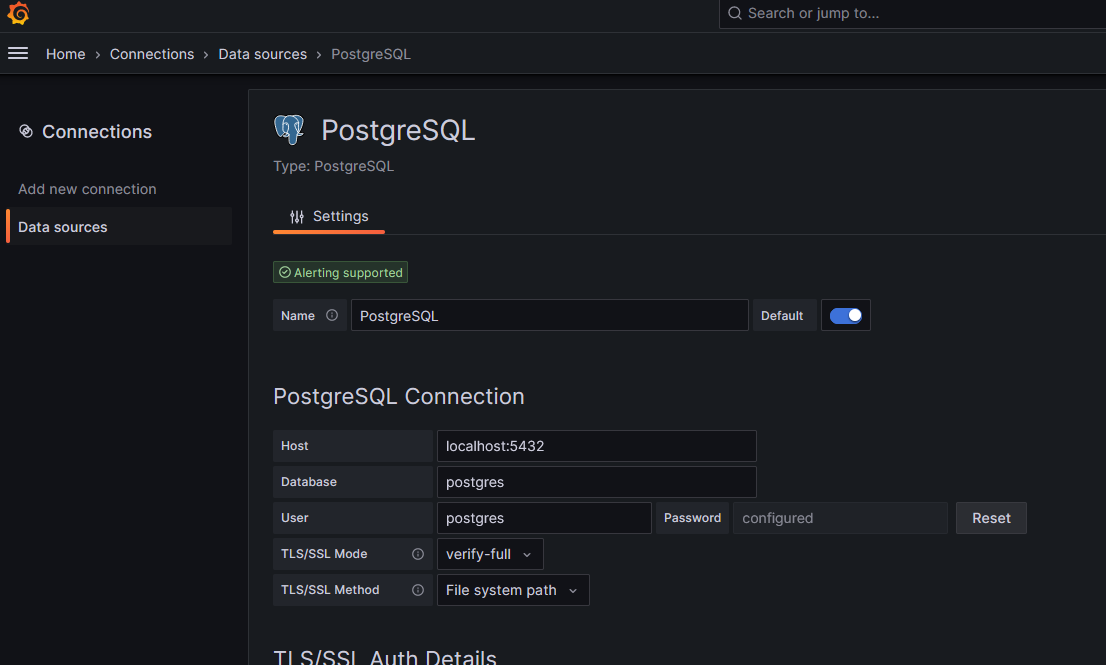
- Click on the “Save & Test” button. If all the settings are ok, then a “database connection ok” message will be shown
Data visualization in Grafana
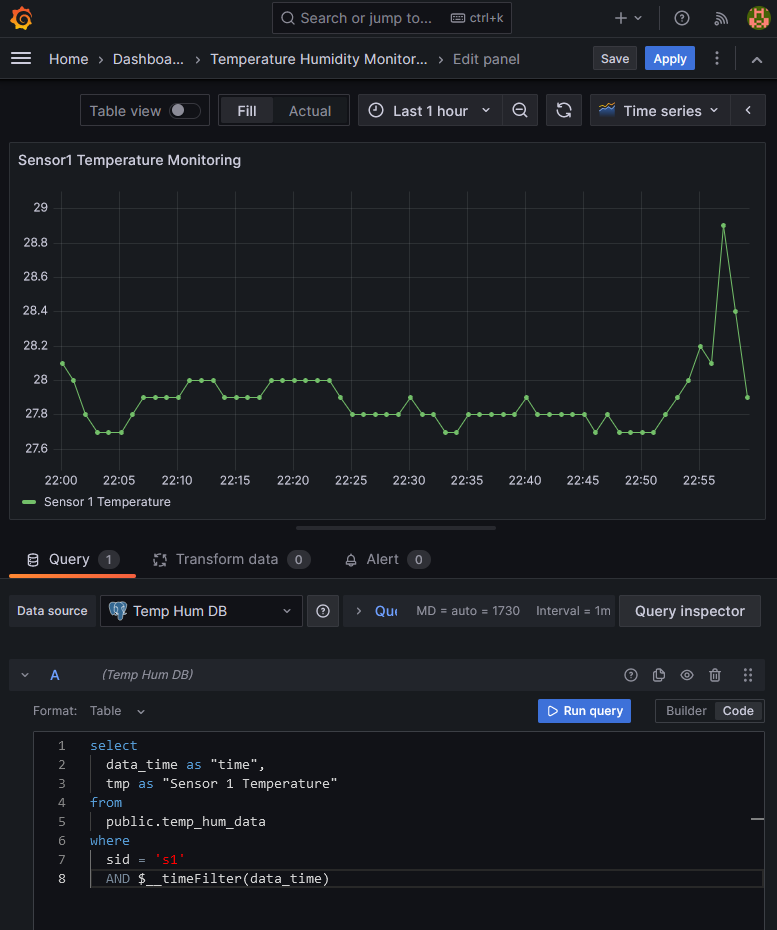
- Create a Grafana dashboard. Create a time-series panel with the sensor data PostgreSQL database as a datasource. Use the following query to fetch the sensor data from database.
select
  data_time as "time",
  tmp as "Sensor 1 Temperature"
from
  public.temp_hum_data
where
  sid = 's1'
  AND $__timeFilter(data_time)
- The
$__timeFilteris a Grafana filter that makes Grafana fetch the data only corresponding to the user selected time range in the dashboard or alert rules - In this way sensor data can be visualized from database in Grafana dashboards very easily
Email Contact point in Grafana

- Search for “Contact Points” page in Grafana. Create a new email contact point with the desired receiver email addresses as shown above
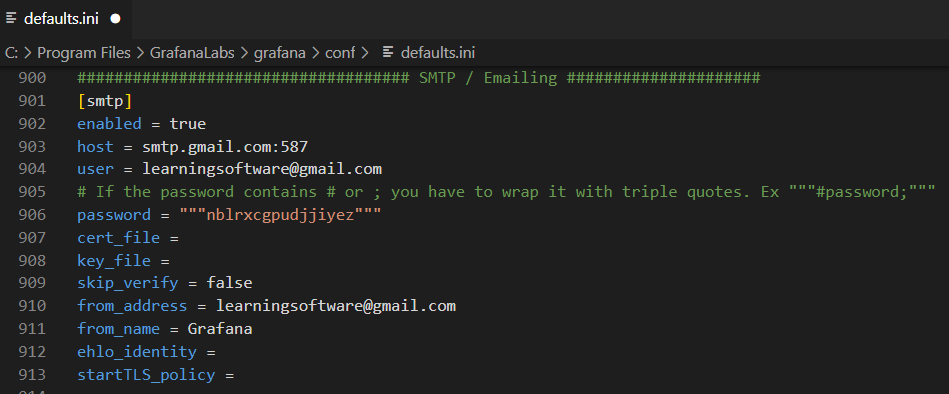
- Make sure that valid smtp settings are configure in the defaults.ini file of Grafana. For this example we are configuring a Gmail account with app password in the smtp settings as shown below. Grafana will use this Gmail account to send emails
Temperature alert setup in Grafana
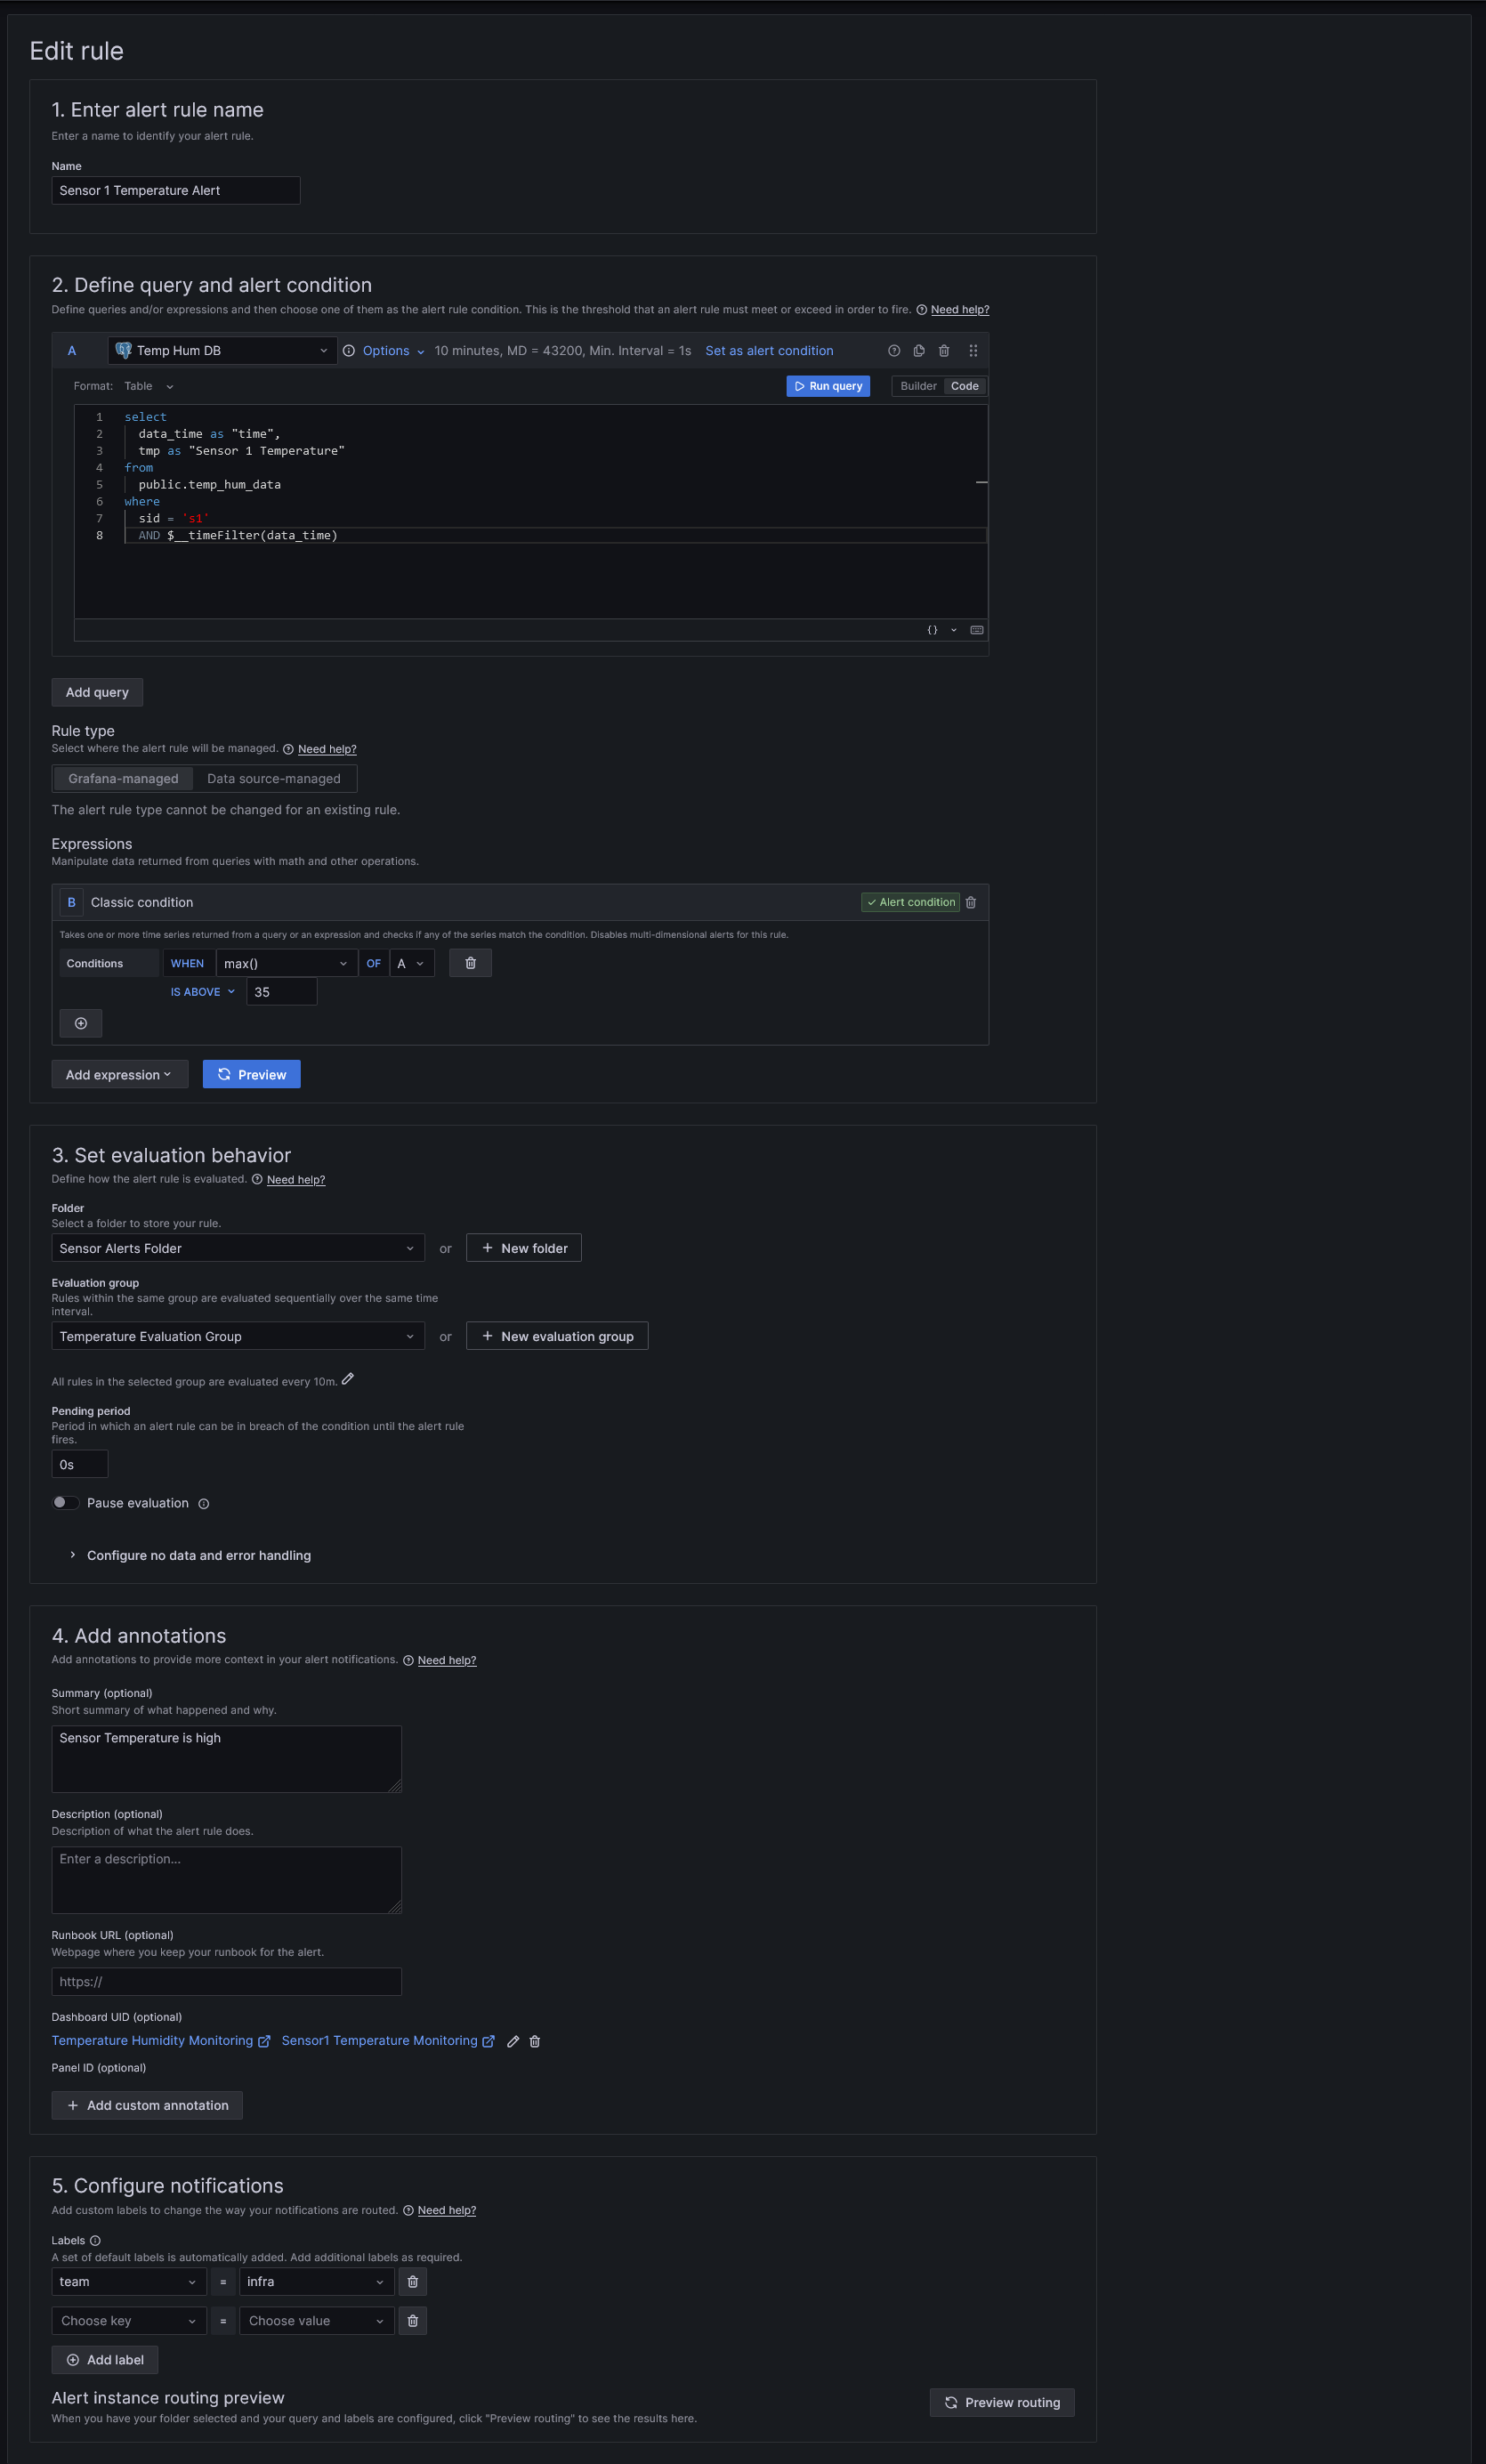
- Search for “Alert Rules” page in Grafana. Create a new alert rule for monitoring the sensor temperature as shown in the above image
- Define the alerting condition data fetch query and threshold evaluation in the “Define query and alert condition” section
- Define the periodicity of alert evaluation (say every 5 mins) in the “Set evaluation behavior” section
- Link dashboard panel to the alert in the “Add annotations section”
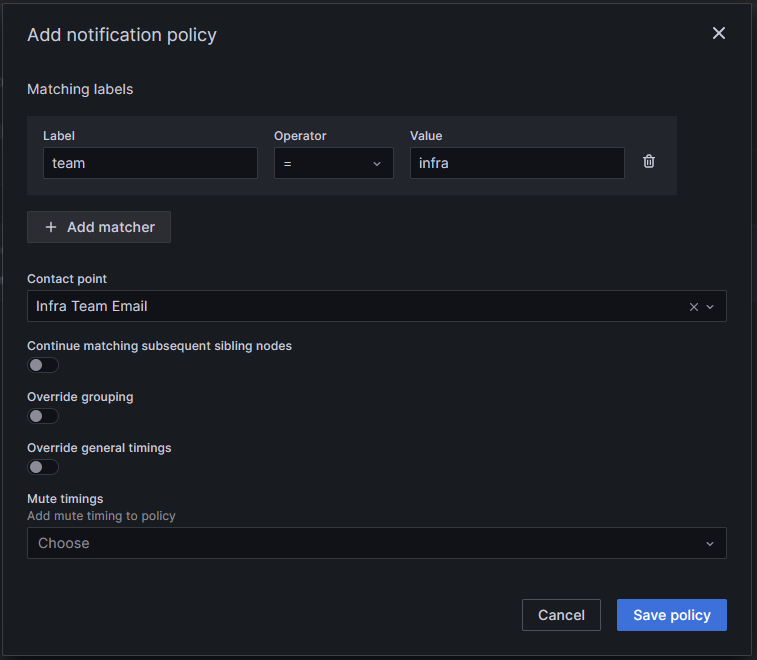
- Add labels to alert rule for linking the alert rule with a contact point in the notification policy screen. For this example, we added the label team=infra to the alert rule
- Go to the “Notification policies” page and create a new nested policy as shown below. The alert rule will use the email contact point for sending alert notifications
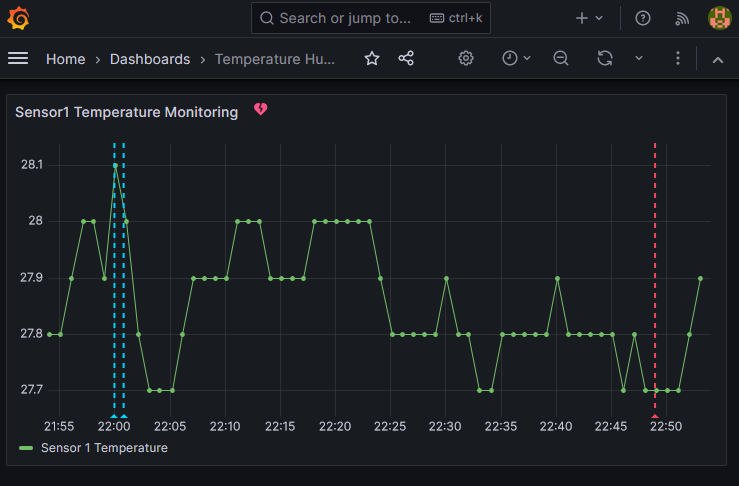
- The alerts would be overlaid on the dashboard as shown below
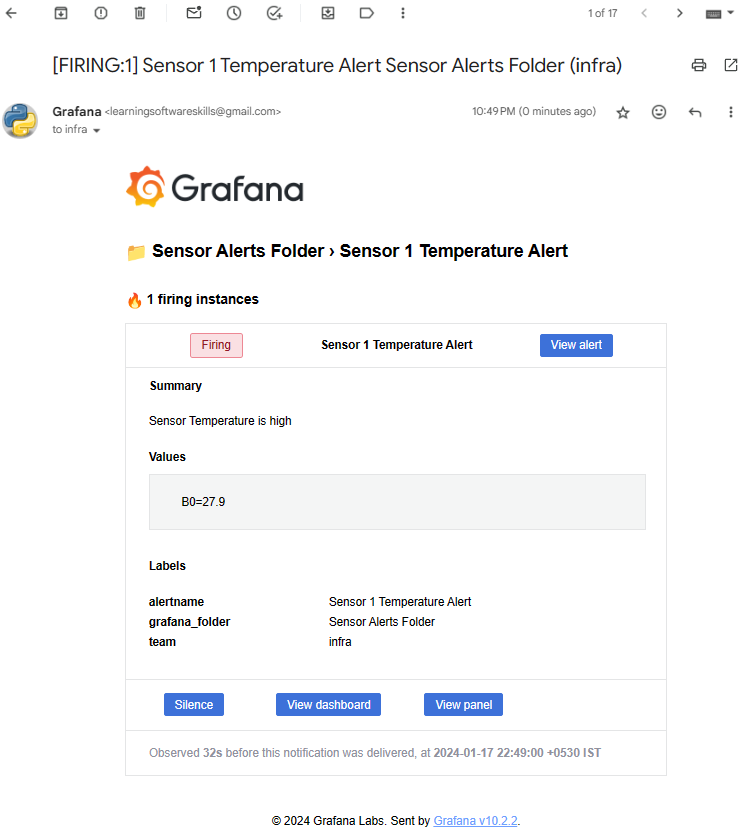
- An email would be sent as shown below when an alert is fired
Video
Video on this post can be seen here
References
- DHT22 temperature sensor python library - https://github.com/adafruit/Adafruit_CircuitPython_DHT
- run psycopg2 in debain distros - https://stackoverflow.com/a/71831274/2746323
- Schedule tasks with less than 1 min interval using systemd - https://stackoverflow.com/a/53557536/2746323
Comments
Post a Comment