Create alerts in Grafana
Real time data monitoring with alerts in Grafana
- An alert can be configured in Grafana to continuously monitor a data point based on user defined alerting conditions.
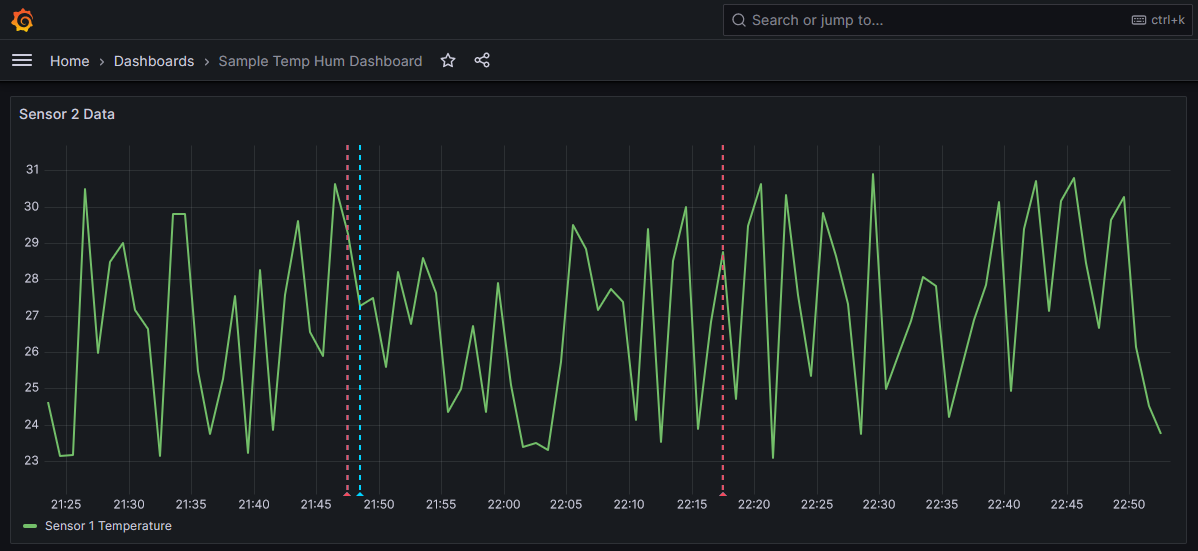
- Emails can also be generated to notify the alerts to stakeholders

Grafana alerts concepts
We need to understand the following concepts to understand the alerting mechanism in Grafana
- Alert Rules
- Alert states
- Contact Points
- Notification Policies
Alert Rules
- An alert rule defines an alert condition (for example, raise an alert if temperature is greater than 25)
- The data source queries, thresholds, labels, annotations etc are all defined in an alert rule
- An alert rule evaluation will create an alert instance which has one of the alert states like OK, Pending, Alerting, No Data, Error
Alert states
Based on the result of the alerting condition, the state of an alert can be one of the following
- OK - Alerting condition is not satisfied.
- Pending - Alerting condition is satisfied but the minimum alert evaluation period is not completed (Example: Alert if temperature is above a value for at least 5 minutes).
- Alerting - Alerting condition is satisfied.
- No Data - Data required for evaluating the alert rule is not present.
- Error - Error occurred while evaluating the alert rule.

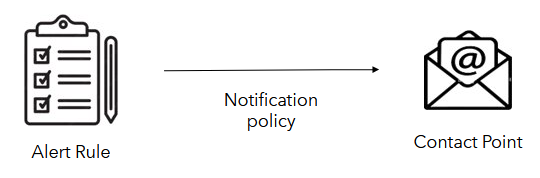
Contact Points
- Contact Points can be used to create notifications when an alert instance changes its alert state
- Contact points can be emails, slack, discord, webhooks etc.

Notification Policies
- Notification policies define which contact points will be used by alerting instances to notify the alert state change
- Alert rule labels are used to define what contact points will be used by an alert rule
Alerts demo in Grafana
- Let us demonstrate a simple alert with email notification in Grafana
- We will use a PostgreSQL Grafana data source that contains temperature and humidity data in the database tables to create the alert rules
- We will define alerting rule, contact point and notification policy to create and deliver the temperature alerts via email
Creating Alert rules in Grafana
Define Alert condition
- Search for “Alert Rules” in the search bar
- Click on Create new alert rule button
- Enter the required data fetching query in the “Define query and alert condition” section
- First select the relevant data source and write the query as shown below. Use the “Options” drop-down beside the data source drop-down to specify the data fetch time interval

- Define expressions to create an alerting condition. Multiple expressions can be chained to create an alerting condition as shown below.
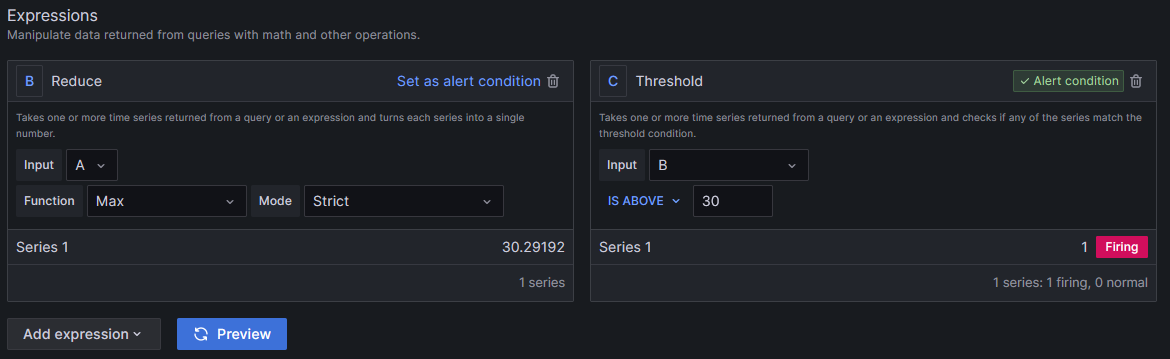
- The expression “B” is of type “Reduce” that uses the data source query “A” to get the maximum value of the fetched data. The expression “C” is of type “Threshold” that evaluates the value generated from expression “B”
- If the expression outcome is 0, the alert state would be OK. If the expression outcome is 1, the alert state would be Alerting. Hence the “Threshold” expression creates an output of 1 when the input value crosses the specified threshold.
- The “Preview” button can be used to see the alert rule evaluation results.
- Instead of creating “Reduce” and “Threshold” expressions, a simple “Classic” expression can also be defined as shown below
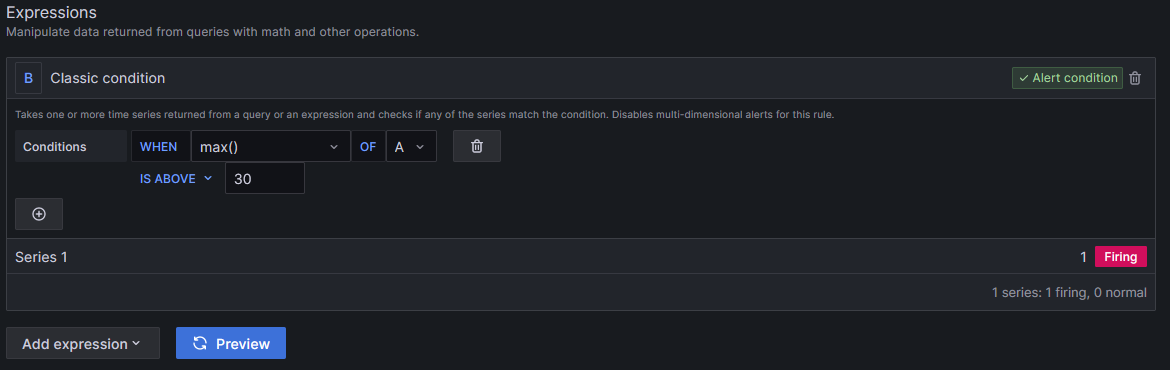
- “Math” expressions can also be used to transform data or combine multiple expressions (like B) if required
Define Evaluation behavior
- After defining the alert conditions, define the evaluation behavior as shown below
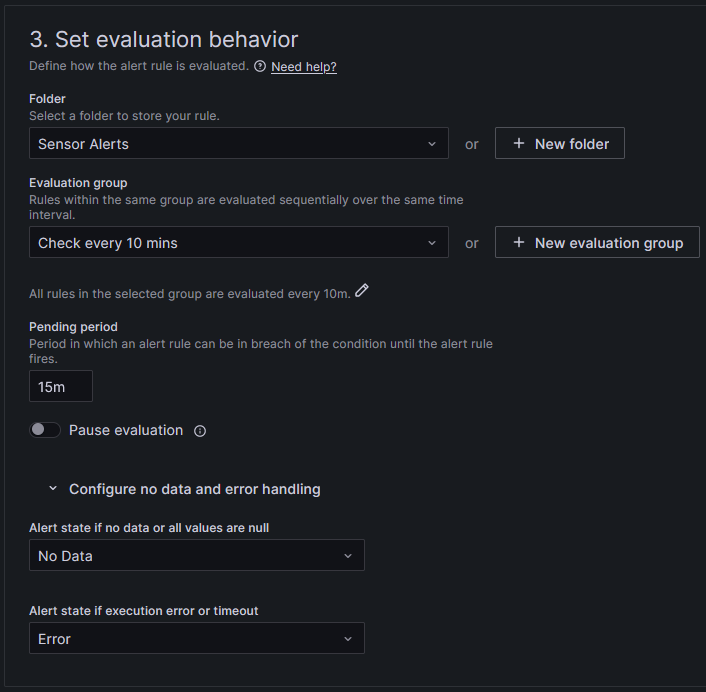
- Select a folder and evaluation group from the drop down (Create if not present)
- The periodicity of alert condition evaluation is defined in the evaluation group
- The “pending period” defines how much time the alerting condition should be met continuously for firing an alert. In this example, the temperature should cross the threshold continuously for at least 15 minutes to fire the alert.Pending period can be set to 0 if not required
- An alert rule can be paused using the “Pause evaluation” switch
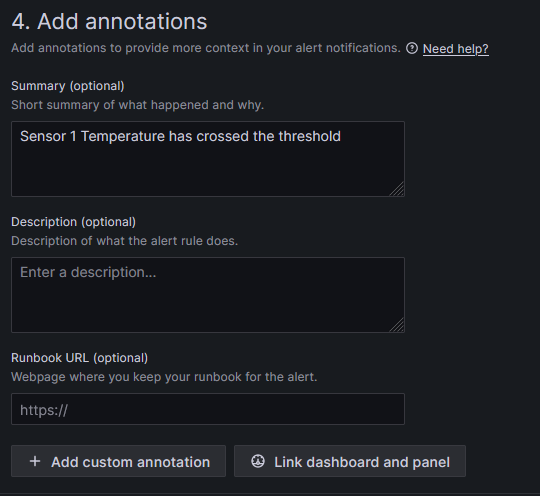
Define the alert summary
- Provide the alert summary in the annotations section as shown below
Define labels
- Add labels (key-value pairs) to the alert rule as shown below.

- Notifications policies will use alert rule labels to determine the contact points to deliver the alert notifications
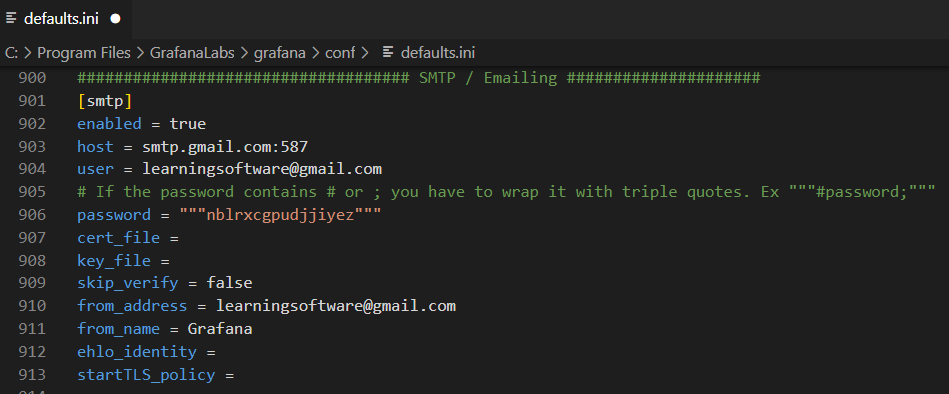
Contact Points
- Contact points are notification channels for delivering alert notifications. Let us create an email contact point.
- For this example, Gmail is configured in the smtp section of Grafana defaults.ini file. So Grafana will use this Gmail account to send emails.
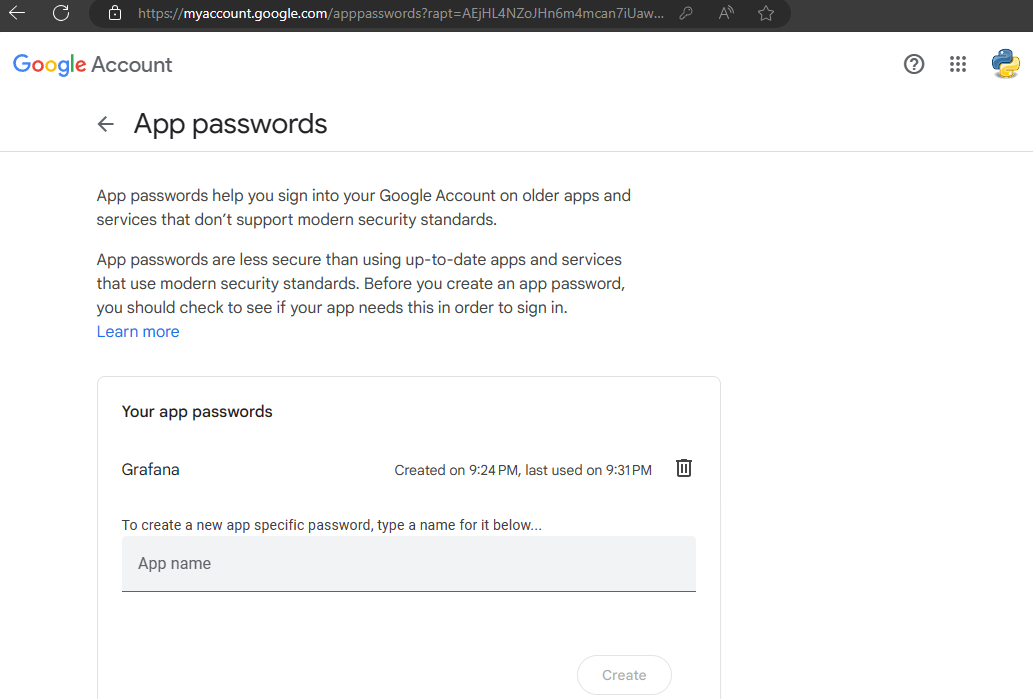
- Gmail Password for Grafana can be generated in the “App Passwords” section of google account as shown below
- Now create a contact point as shown below from the “Contact points” page. Notice that multiple emails or other type of integrations can be kept in a single contact point

Notification Policies
- Go to the “Notification policies” page and create a new nested policy as shown below
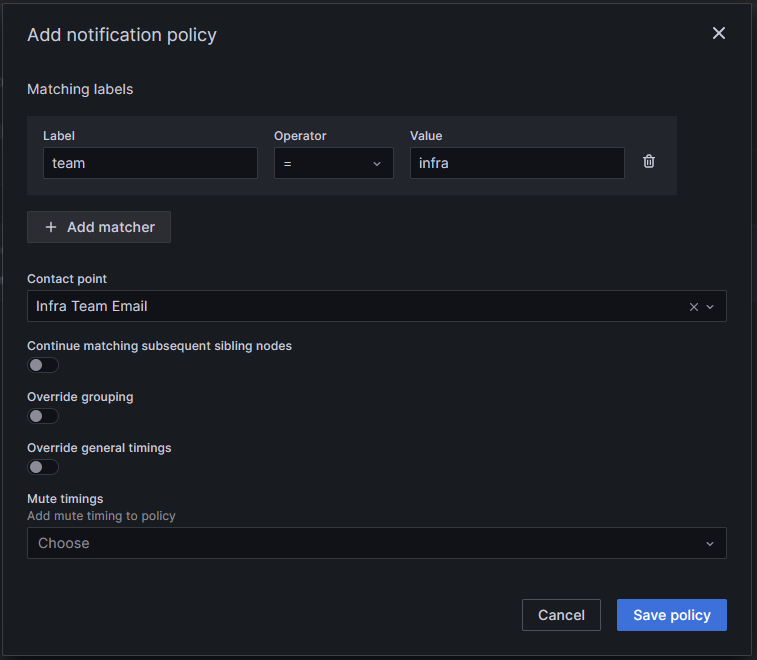
- All the alert rules that contain the label “team=infra” will use the contact point “Infra Team Email” using the above notification policy
Video
Video on this post can be seen here
References
- Official demo - https://vimeo.com/720001629
How would you go about customizing the email subject/message to something more meaningful?
ReplyDelete