Setup Grafana in Windows
- Go to Grafana website and download Grafana installer from
Productssection at https://grafana.com/grafana/download - Select the edition as OSS (Open Source Software) and select the version from the drop down menus
- Download the windows Grafana installer
- Run the installer to install Grafana

Access Grafana in browser for first use
- Grafana by default runs on port 3000. So it can opened in the browser at
http://localhost:3000. The login screen will appear

- The default username is
adminand password isadmin. Change the password to a better one after logging in with default password - A home page as shown below should be displayed after logging in

Restart, Stop, Disable Grafana windows service
- Grafana runs as a windows background service
- Hence the Grafana service can be restarted, stopped or disabled from the Services app of Windows
- The Services app can be opened using the command
services.mscin a command line or directly searching for the app “Services” - Grafana is located in the services list with the name “Grafana”
- The start up behavior of Grafana can also be changed from the properties of the service by double clicking the service in the list

View Grafana logs
- Grafana logs are stored in
C:\Program Files\GrafanaLabs\grafana\data\logfolder - These logs can be useful to debug the errors in Grafana installation

Change Theme, Timezone, Organization name
- In Grafana portal, search for Preferences section in the search bar and open the Default Preferences page
- Change the Organization name, Timezone, Dark or Light theme in this preferences page

Configure Grafana
- Grafana can be configured with the configuration file located at
C:\Program Files\GrafanaLabs\grafana\conf\defaults.inifile

-
There are many sections in the defaults.ini file for configuring grafana
Configure Grafana port, IP address, protocol, domain name, SSL
- This can be configured in the [server] section of the defaults.ini file
Configure Grafana database
- By default, Grafana uses an sqlite database for storing its data. This can be changed or managed in the [database] section of the default.ini file
Configure Grafana security aspects like default admin credentials, admin email, encryption key
- This can be configured in the [security] section of the defaults.ini file
Configure Grafana mail server
- This can be configured in the [smtp] section of the defaults.ini file
- Grafana uses this settings to send emails for various purposes like email alerts
Configure logs generated by Grafana
- This can be configured in the [log] section of the defaults.ini file
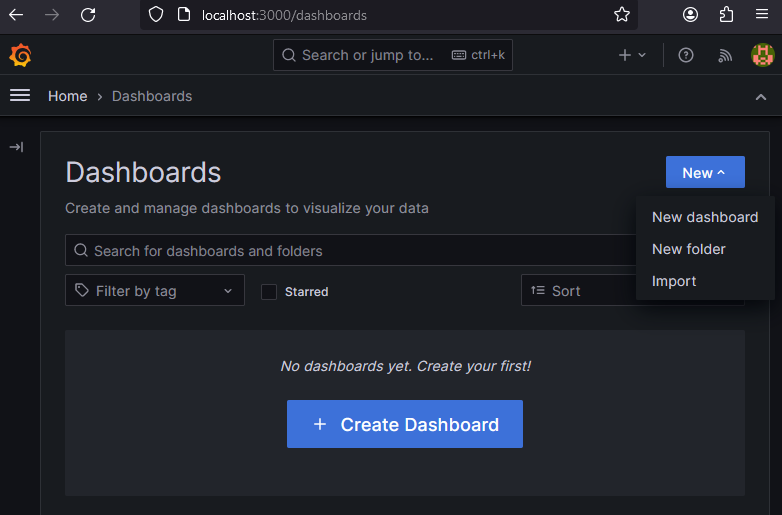
Create Dashboards in Grafana
- Open Dashboards page from search bar or from the left menu
- Click the New dashboard button to create a new dashboard
- Add Visualizations to the dashboard and save the dashboard
Install Grafana plugins with grafana-cli
- Grafana plugins can be installed from command line using
grafana-cli.exelocated inC:\Program Files\GrafanaLabs\grafana\binfolder - Open a command line the bin folder and run the command
grafana-cli.exe plugins install <plugin-id> - The plugin-id can be found by searching for plugins at https://grafana.com/grafana/plugins
- For example Grafana Image Renderer plugin can be installed using the command
grafana-cli.exe plugins install grafana-image-renderer - A plugin can be removed using the command
grafana-cli.exe plugins remove <plugin-id>
Uninstall Grafana
- Grafana can be uninstalled just like other programs in the Control panel
- After un-installation, the folder
C:\Program Files\GrafanaLabscan also be deleted
Video
Video on this post can be seen here
References
- Grafana configuration file docs - https://grafana.com/docs/grafana/latest/setup-grafana/configure-grafana/
- grafana-cli plugins docs - https://grafana.com/docs/grafana/latest/cli/#plugins-commands
Comments
Post a Comment