Connect Grafana with PostgreSQL for time series visualization
Let us connect Grafana with a PostgreSQL database and visualize time series data from the database in Grafana dashboards
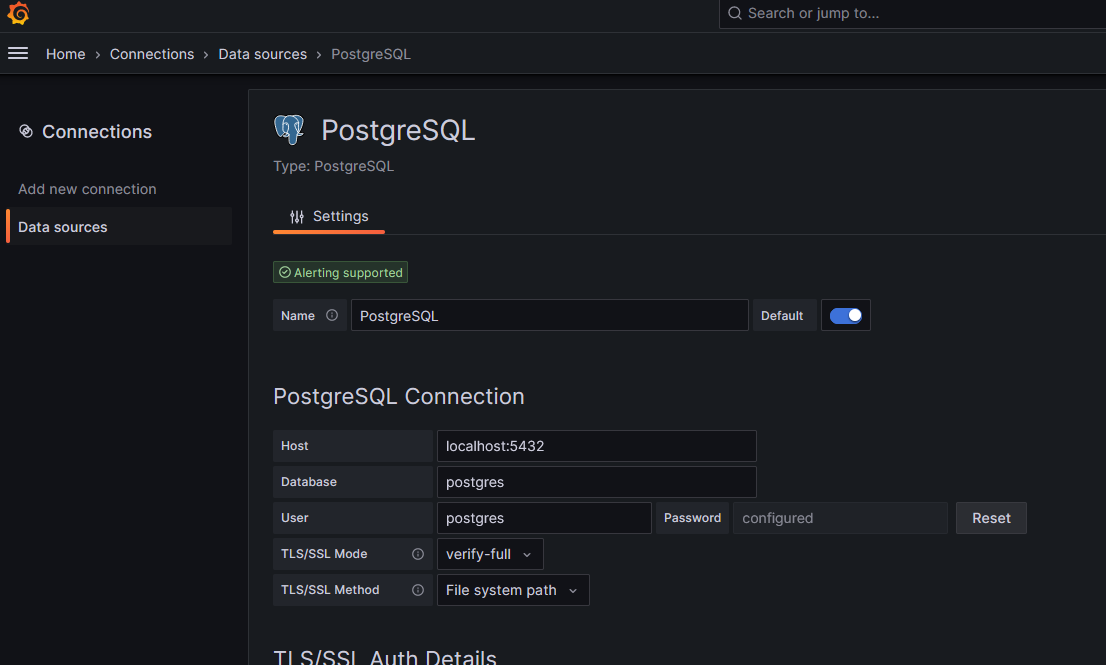
Configure PostgreSQL Grafana data source
- Search for “Data Sources” page in Grafana
- In the data sources page, click on “Add new data source” button and search for the PostgreSQL data source
- Configure the PostgreSQL data source with required settings like database host URL, database name, username, password etc
- Click on Save & Test button. If all the settings are ok, then a “database connection ok” message will be shown
Example database table for data visualization
- A simple database table for showing time series data in Grafana can be created with the following SQL query
create table
  public.temp_hum_data (
    id bigint generated by default as identity,
    data_time timestamp with time zone not null default now(),
    tmp real not null,
    hum real not null,
    sid text not null,
    constraint temp_hum_data_pkey primary key (id),
    constraint temp_hum_data_sid_unique unique (data_time, sid),
    constraint temp_hum_data_sid_check check ((length(sid) < 50))
  ) tablespace pg_default;
- The above table contains columns for timestamp (data_time column), temperature (
tmpcolumn), humidity (humcolumn) and sensor id (sidcolumn) - After creating the table, insert some dummy data into the table using a csv file or SQL. The below SQL inserts dummy data into the PostgreSQL table for the last 4 hours
do $$
-- declare a timestamp variable
DECLARE timestmp timestamptz;

begin
	-- delete all data if required
	--delete from public.temp_hum_data where 1=1;

	-- run a for loop for last 4 hours
	for cnt in 1..60*4 loop
		-- print the count
		raise notice 'cnt: %', cnt;

		-- set the timestamp variable as per for loop iterator
		select (now()-cnt*interval '1 minute')::timestamptz into timestmp;

		-- insert random temperature (between 30, 23) and humidity (between 42, 48) data for sensors s1 and s2.
		insert into public.temp_hum_data (data_time, tmp, hum, sid) values (timestmp, random()*(30-23+1)+23::float4, random()*(48-42+1)+42::float4, 's1');
		insert into public.temp_hum_data (data_time, tmp, hum, sid) values (timestmp, random()*(30-23+1)+23::float4, random()*(48-42+1)+42::float4, 's2');
	end loop;
end; $$
Query in Grafana panel editor

- Let us visualize the temperature of sensor ‘s1’ for the last 5 hours
- Create a dashboard and add a visualization panel. In the query editor, select the data source as the PostgreSQL data source configured to connect to the desired database
- In the query A, toggle the query mode from Builder to Code. Use the below query in the query editor.
SELECT
  data_time AS "time",
  tmp AS "s1_temperature"
FROM
  temp_hum_data
where
  sid = 's1'
  AND $__timeFilter(data_time)
- The above query is a simple SQL SELECT script to fetch the temperature of the sensor ‘s1’ from the database table
- Notice that the database column “data_time” is aliased as “time” in the SELECT SQL statement. This is because the SQL output should contain a column named “time” which contains the timestamps for time series visualization in Grafana
- Notice that the macro
$__timeFilter(data_time)is used in the SQL WHERE condition. If this condition is not used, all the table values will be fetched without considering the user defined time range selection in Grafana
Video
Video on this post can be seen here
References
- Grafana documentation on macros for time series queries - https://grafana.com/docs/grafana/latest/datasources/postgres/#macros
- Documentation on time series queries options in Grafana PostgreSQL data source - https://grafana.com/docs/grafana/latest/datasources/postgres/#time-series-queries
Comments
Post a Comment