Intro to Grafana
What is Grafana
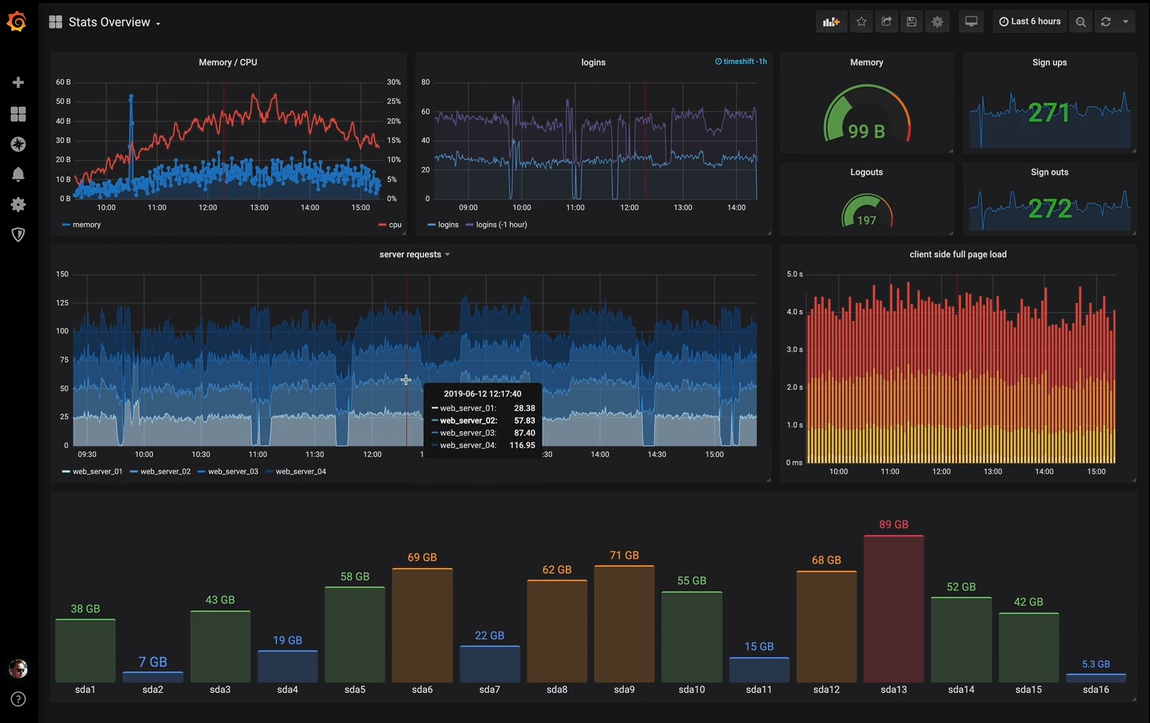
- Grafana is a data visualization, analytics and alerting platform
- Interactive dashboards can be created in Grafana for this purpose
Grafana use cases
- Visualize data from multiple data sources in a single platform
- Create dashboards that update in real-time
- Generate real-time alerts by continuously monitoring data from data sources
- Enable users without coding skills to build, share and collaborate visualizations and dashboards in a central location
- Create an interactive data exploration and analytics platform
- Avoid licensing costs opensource data analytics platform
Main Components of Grafana dashboards
- Panels - Display data
- Data Source - Provide data to panels
- Plugins - Add more panels and data sources
- Transformations - New data from existing data based on calculations
- Alerts - Alerts from data based on user-defined conditions
Video
Video on this post can be seen here
References
- Grafana showcase - https://grafana.com/grafana
- Grafana playground - https://play.grafana.org
Comments
Post a Comment